Relution-Monitoring with Grafana (Optional)
Introduction
Relution provides a variety of metrics that can be visualised using Grafana. Below we have provided a basic configuration for a Docker setup and two dashboards. These configurations can be adapted according to your own needs. If you want to monitor a remote server, you will find the configuration on the bottom of this site.
Prometheus, Grafana and the individual dashboards are not maintained by Relution Support.
Local service configuration
This configuration implements Prometheus and Grafana in an on-premises Relution setup in a Docker environment.
If you want to monitor a server that you do not have direct access to, for example, you will find the configuration below.
Necessary files and directories
As mentioned, the configurations are available, can be downloaded here →.
Files
- docker-compose.yml
- Contains the configurations of the Docker containers
PrometheusandGrafana.
- Contains the configurations of the Docker containers
- prometheus.yml
- Contains the configuration of
Prometheus.
- Contains the configuration of
- .env
- Contains the variables
GF_SECURITY_ADMIN_USERandGF_SECURITY_ADMIN_PASSWORD. For productive operation it is recommended to change the password.
- Contains the variables
Subfolder
Dashboards Sample dashboards: The configuration files for two sample dashboards are included. These dashboards are automatically imported into the Grafana Docker container.
Provisioning Base configurations: The configuration files for the Prometheus data source and the two sample dashboards are included. These configurations can be adapted as required.
Integration of the docker-compose.yml
The docker-compose.yml described here can be used in two ways:
Standalone The file can be used as a standalone file.
Content The content of the can be included in an existing docker-compose.yml.
In our example, the content of the file is included in the existing docker-compose.yml.
In this case, it is important that the files and directories of the volumes are in the appropriate place and have the correct permissions.
In our docker-compose.yml the containers mariadb, relution and nginx are present, so lines two to four have only been inserted for orientation.
services: # already present
  # mariadb:  already present
  # relution:  already present
  # nginx:  already present

  prometheus:
    image: prom/prometheus:${DOCKER_PROMETHEUS:-latest}
    volumes:
      - ./prometheus.yml:/etc/prometheus/prometheus.yml
    networks:
      relution-network:
    ports:
      - "${PORT_PROMETHEUS:-9090}:9090"
    expose:
      - "9090"
    logging:
      driver: "json-file"
      options:
        max-size: "${DOCKER_PROMETHEUS_LOGSIZE:-8m}"
        max-file: "4"
        compress: "true"

  grafana:
    image: grafana/grafana:${DOCKER_GRAFANA:-latest}
    volumes:
      - ./provisioning:/etc/grafana/provisioning
      - ./dashboards:/var/lib/grafana/dashboards
    depends_on:
      - prometheus
    environment:
      # set the placeholder in dashboard, to the actual name of datasource
      DS_PROMETHEUS: "Prometheus"
      # set grafana default admin user
      GF_SECURITY_ADMIN_USER: "${GF_SECURITY_ADMIN_USER}"
      # set grafana default admin password
      GF_SECURITY_ADMIN_PASSWORD: "${GF_SECURITY_ADMIN_PASSWORD}"
    networks:
      relution-network:
    ports:
      - "${PORT_GRAFANA:-3000}:3000"
    expose:
      - "3000"
    logging:
      driver: "json-file"
      options:
        max-size: "${DOCKER_GRAFANA_LOGSIZE:-8m}"
        max-file: "4"
        compress: "true"
In the docker-compose.yml the ports for Prometheus and Grafana are set to 9090 and 3000 respectively.
This section can be inserted into the existing docker-compose.yml for the example.
Adjusting the .env file
For security, it is recommended to adjust the password parameter.
GF_SECURITY_ADMIN_USER=admin
GF_SECURITY_ADMIN_PASSWORD=password
Anpassungen der prometheus.yml Datei
global:
  # Default scrape interval
  scrape_interval: 15s

scrape_configs:
  # Job to scrape Prometheus metrics
  - job_name: "prometheus"
    scrape_interval: 5s
    static_configs:
      - targets: ["localhost:9090"]

  - job_name: "relution"
    # Job to scrape application metrics
    metrics_path: "/actuator/prometheus"
    scrape_interval: 5s
    static_configs:
      # Call the docker host inside container
      - targets: ["relution:8099"]
In our concrete setup, the last line must contain the name of the container and the port 8099, in this case relution:8099.
With the command docker ps, the name and port of the container used can be checked and then adjusted if necessary.
When the containers are downloaded and started with docker compose down or docker compose up -d, the Grafana UI is accessible under the IP of the server and port 3000.
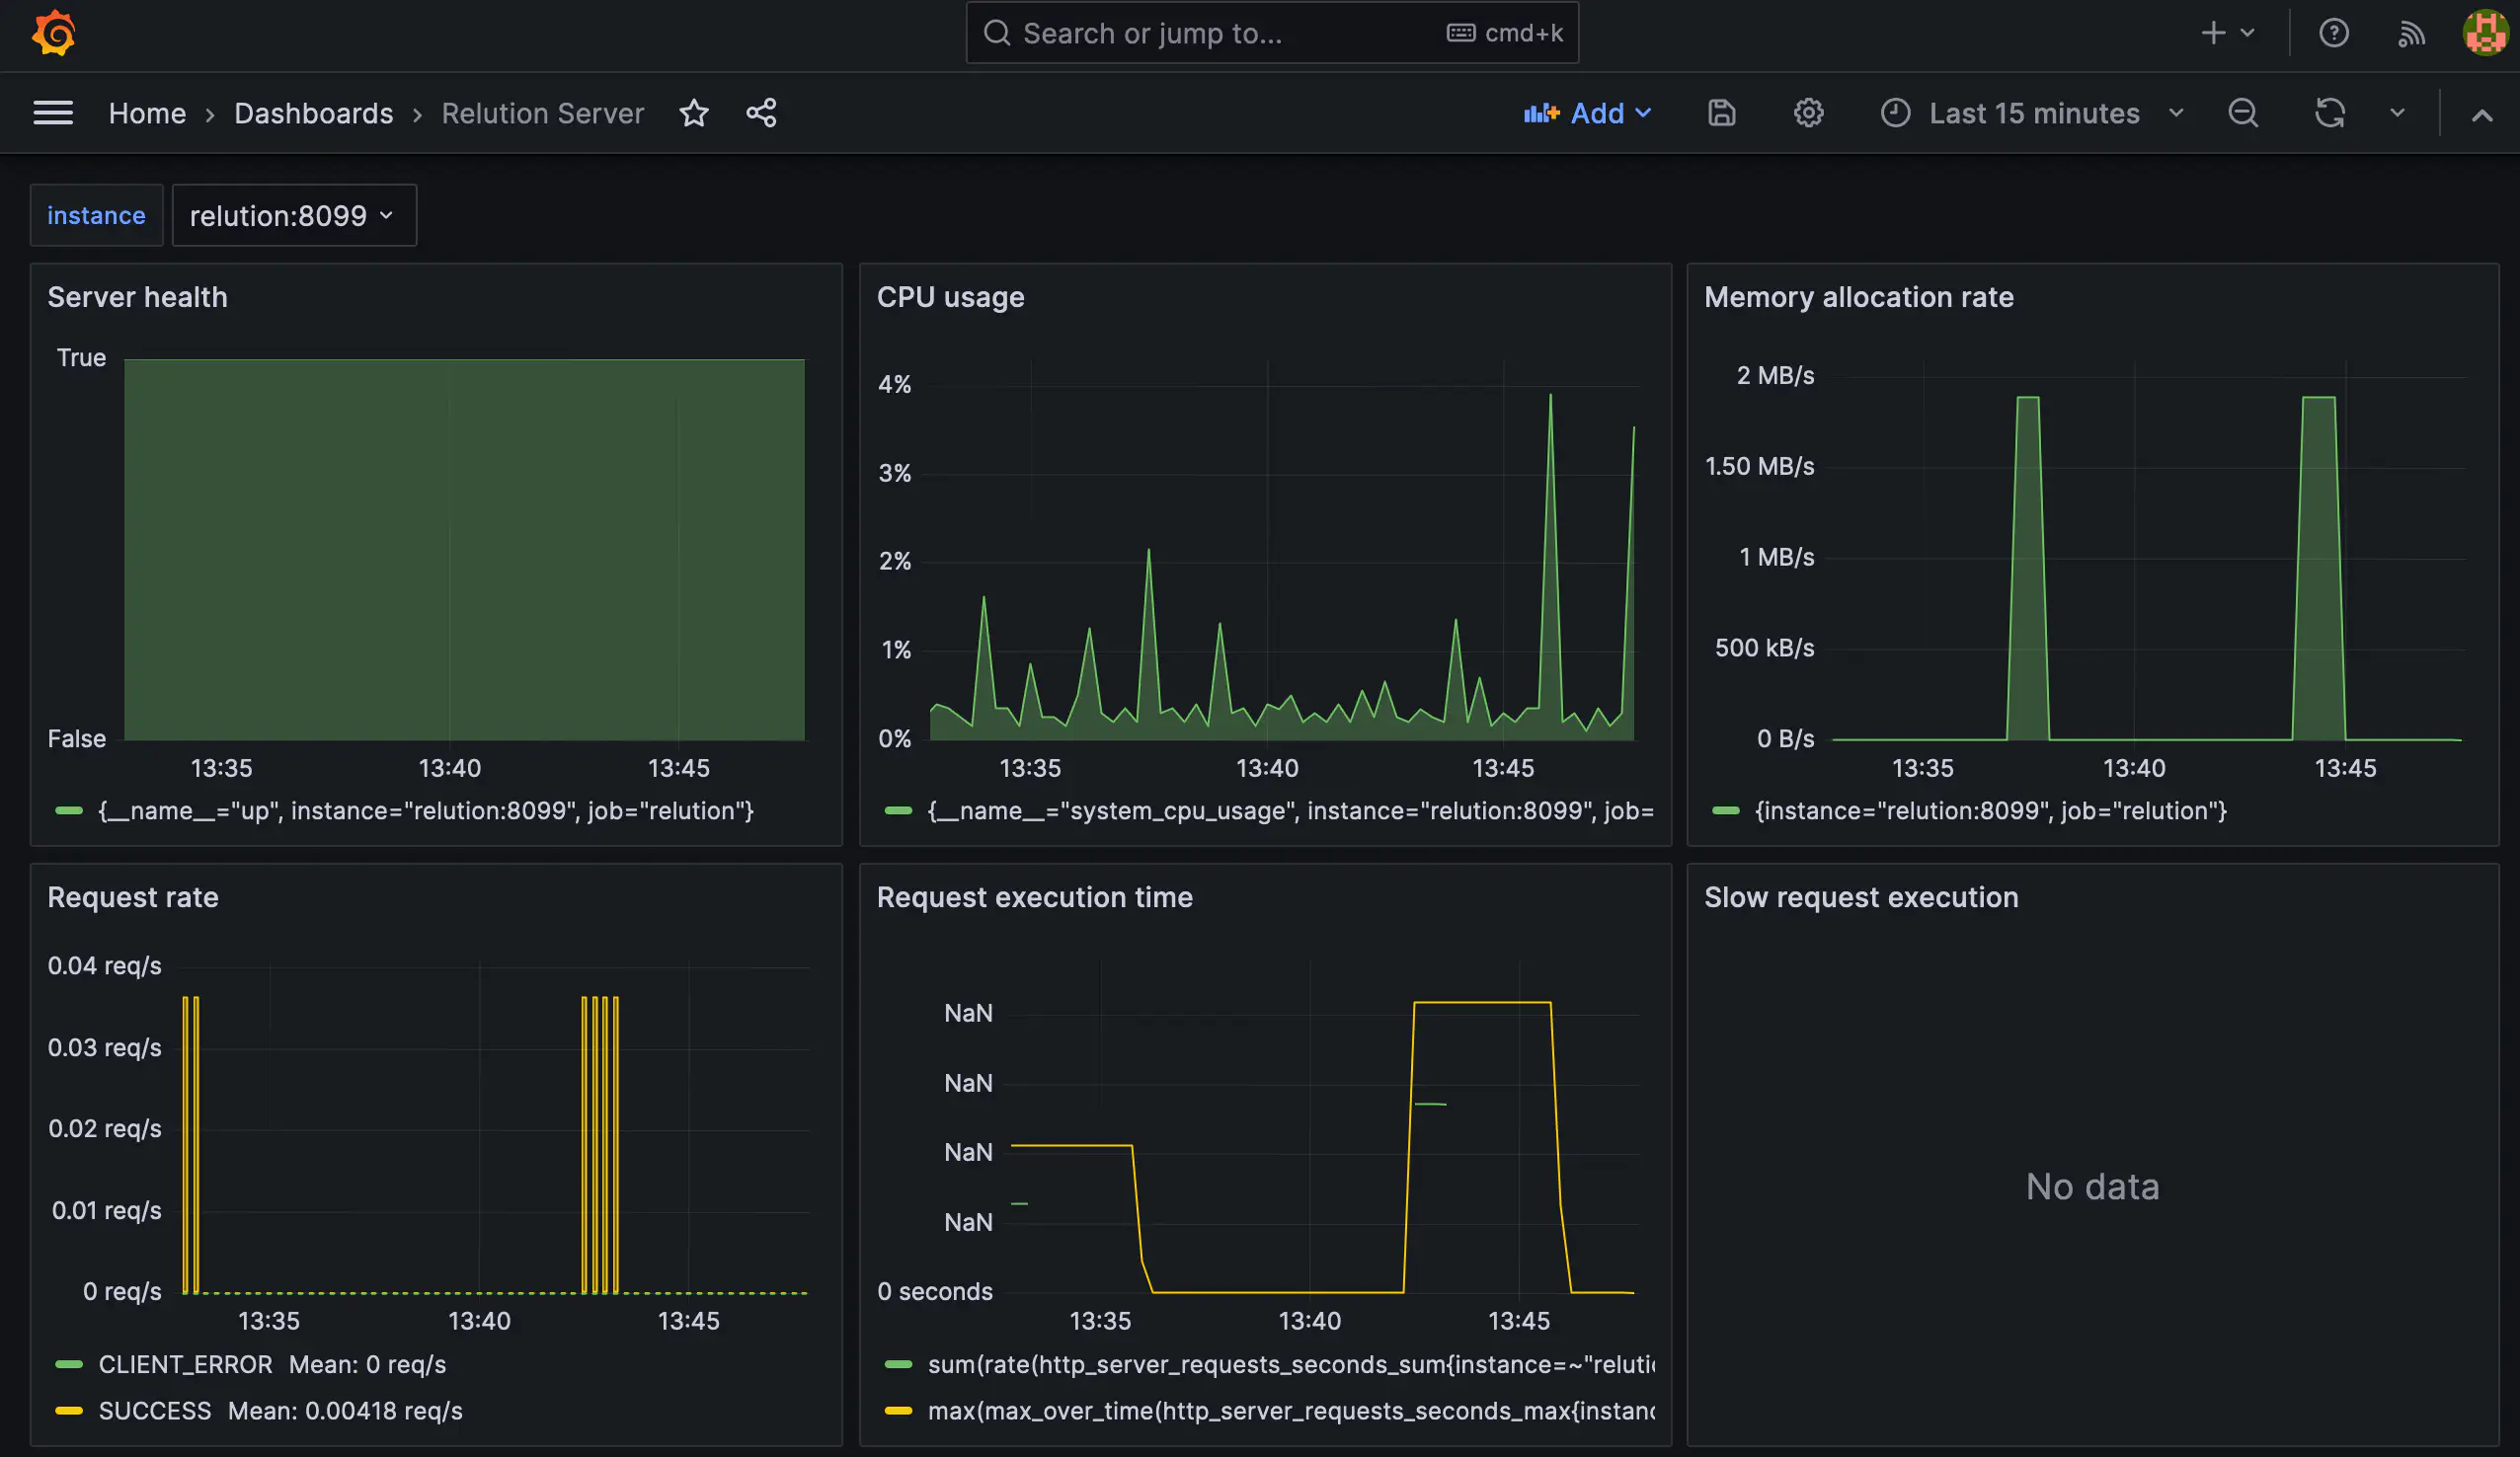
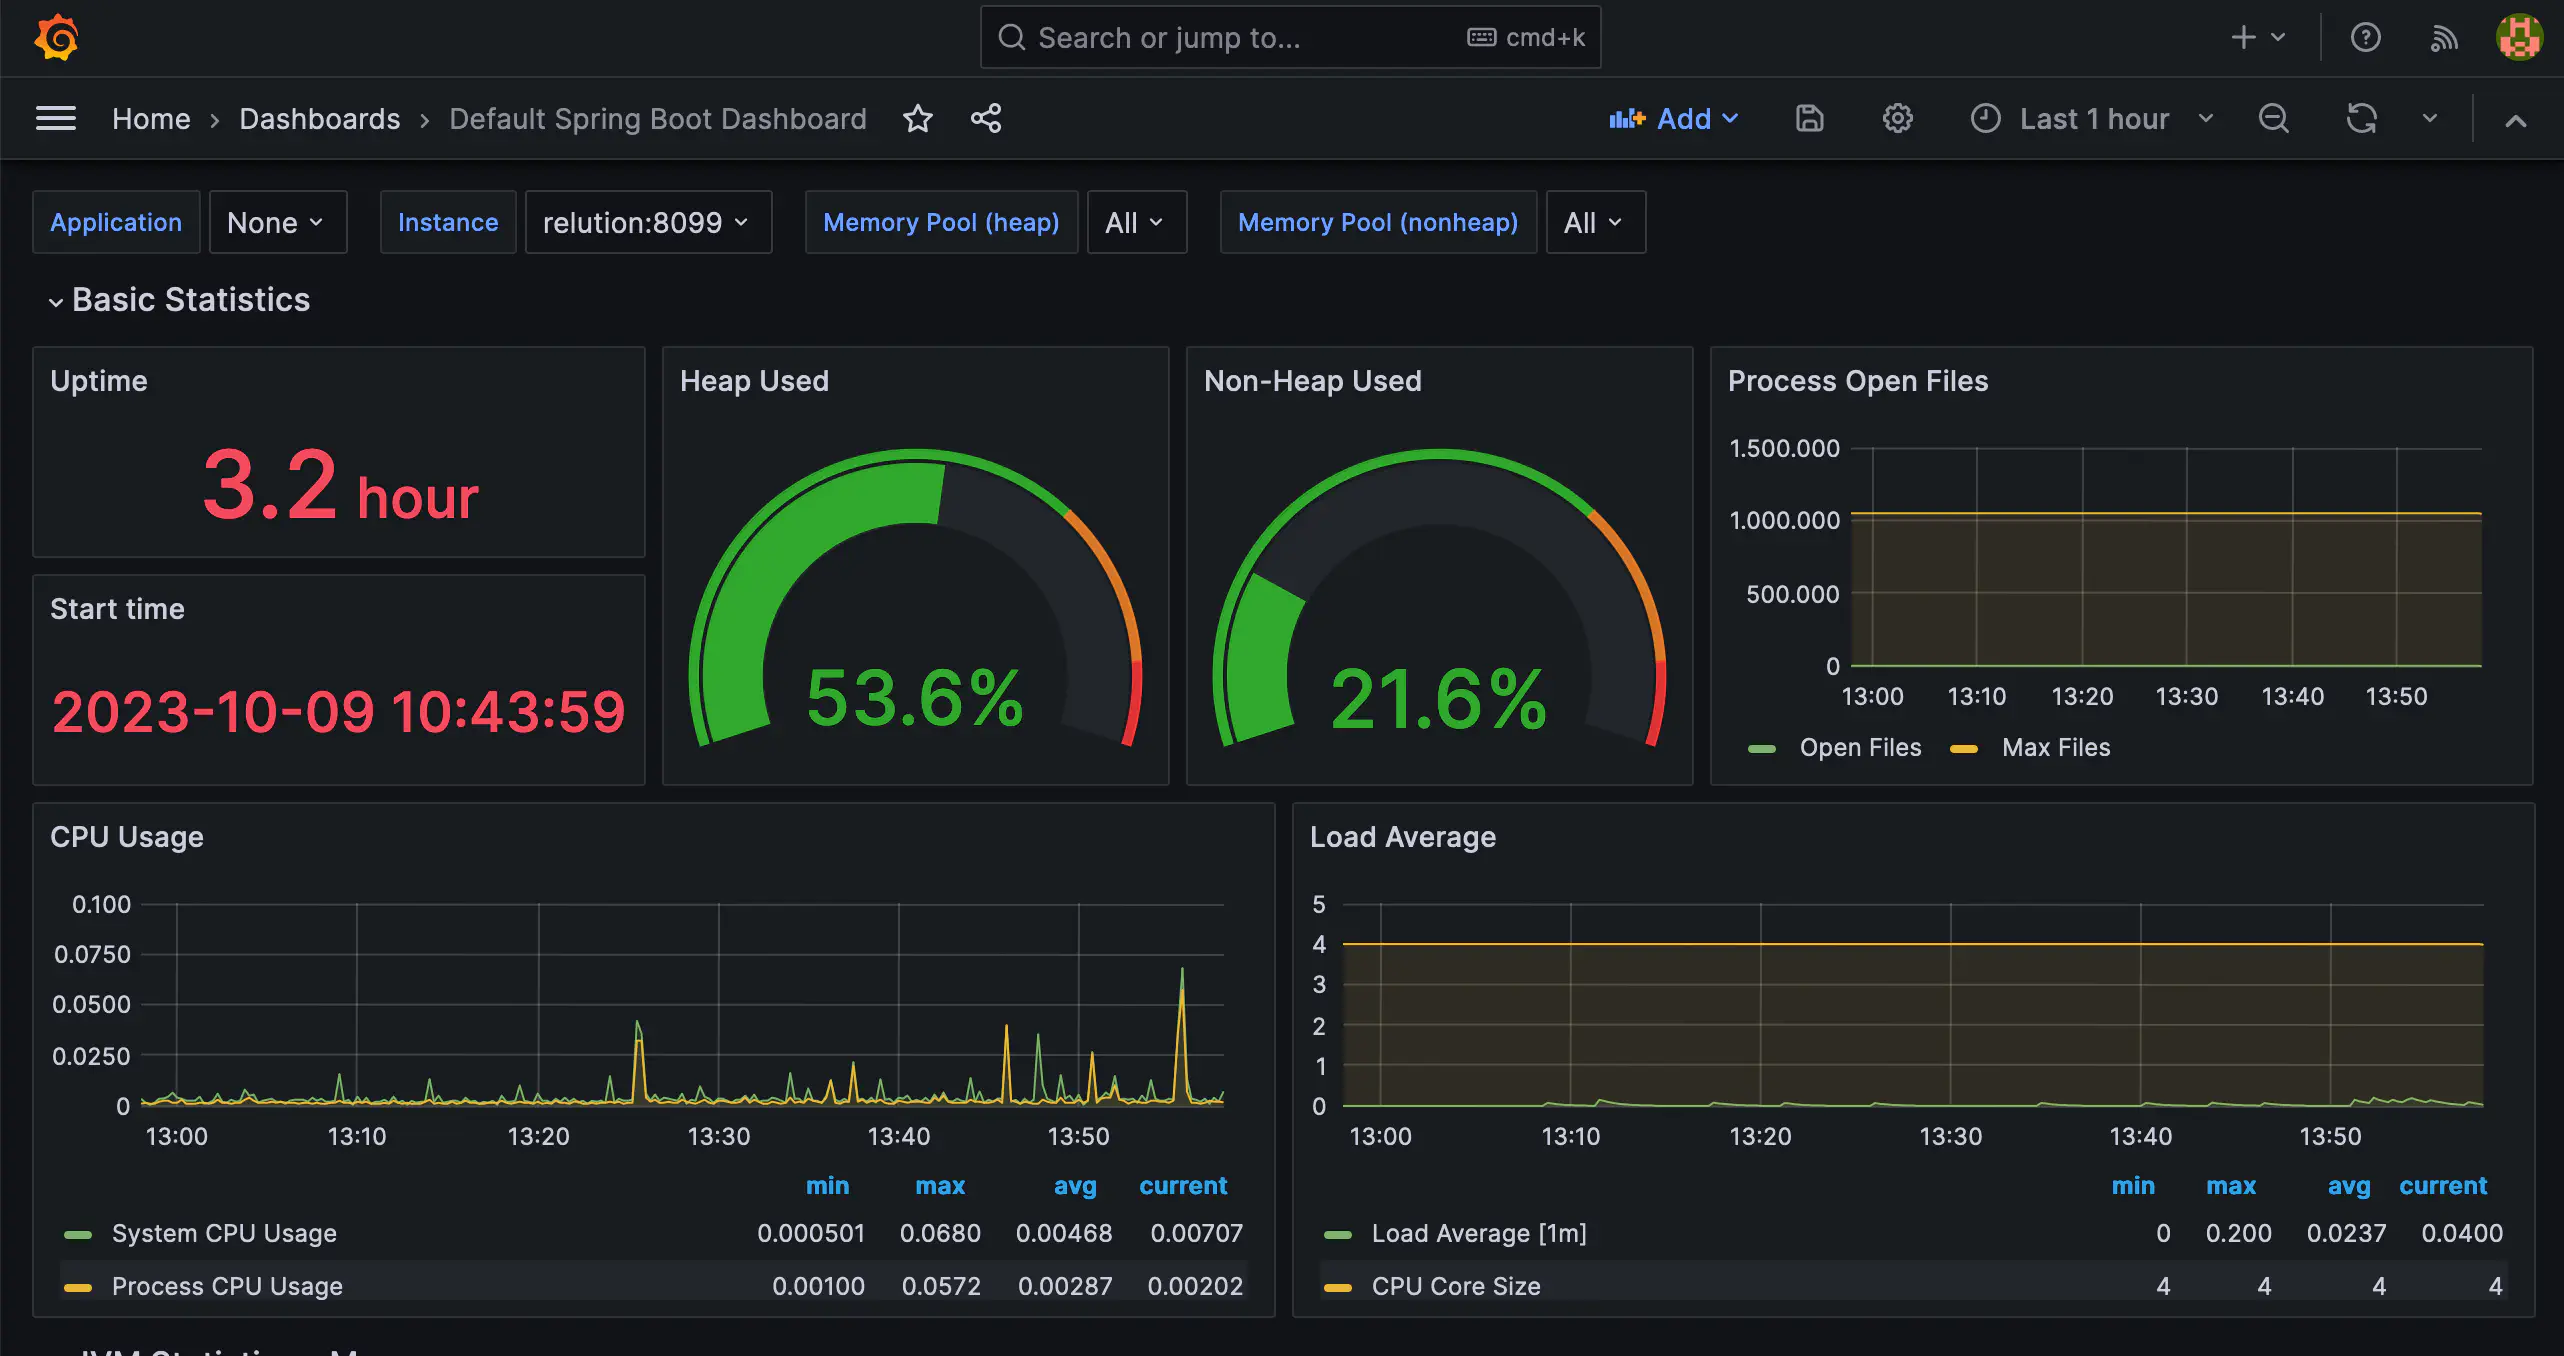
Two dashboards are now available.
Dashboards
Relution Server Dashboard:
Default Spring Boot Dashboard:
Remote Server Configuration
In this scenario, Grafana is also operated within a Docker container. Specific adjustments are required to correctly read the metrics. The primary difference from the local configuration is that this setup communicates with the Relution instance via HTTPS.
Preparation in Relution
Before starting the containers, a corresponding user must exist in Relution:
- Organization: The user must be created within the Global Organization.
- Permissions: Assign the Health Check (or System State) permission to the user.
- Authentication: Access must be configured via Basic Authentication.
- User accounts using OIDC (Single Sign-On) will not work for this purpose.
- Multi-Factor Authentication (MFA) must be disabled for this specific account.
Download and Extraction
Download the prepared configuration files:
Download Grafana Setup →
Extract the archive into a directory of your choice on the target server.
Adjusting Configuration Files
File: compose.yml
Adjust the environment variables for administrative access to the Grafana interface:
GF_SECURITY_ADMIN_USER: Your desired administrator username.GF_SECURITY_ADMIN_PASSWORD: A secure password for the Grafana login.
File: prometheus.yml
This file defines the connection to the Relution interface. Replace the placeholders with your specific data:
| Parameter | Description |
|---|---|
$SERVER_URL | The external URL of your Relution server (Important: without the https:// prefix). |
username | The username of the Relution user created in step 1. |
password | The corresponding password for that user. |
Deployment
Once the configuration is complete, the containers can be started. Run the following command in the directory:
docker compose up -d
Access Notes:
- Grafana is accessible via port 3000 by default.
- Depending on server hardening, access is possible directly via IP/domain or securely via an SSH tunnel.
To access Grafana securely via an SSH tunnel, you can use port forwarding. This is particularly useful if port 3000 is closed in the server’s firewall.
Establish the SSH Tunnel
Run the following command in your local terminal (Windows PowerShell, macOS, or Linux):
ssh -L 3000:localhost:3000 username@your-server-ip
Parameter Explanation:
-L 3000:localhost:3000: This forwards port 3000 of your local machine to port 3000 of the remote server.username: Your SSH user on the server.your-server-ip: The IP address or hostname of your remote server.
Accessing the Interface
- Keep the terminal window with the active SSH connection open.
- Open your web browser.
- Enter the following in the address bar:
http://localhost:3000 - Log in using the credentials defined in the
compose.ymlfile (GF_SECURITY_ADMIN_USERandGF_SECURITY_ADMIN_PASSWORD).