Set log level
In some cases the cause of a problem cannot be identified in the default log level. In this case the log level can be adjusted accordingly and the information output can be increased.
The log level can be set via the application.yml, the system portal or via API.
The DEBUG log level should only be used for analysis purposes, as significantly more information is written to the log and the log grows accordingly. The log level can be adjusted in the system portal. Since Relution 5, this must be activated beforehand as additional security.
Logfile Location
Relution’s log files can be found in the log directory located underneath its installation directory. Logs are rotated automatically once a day and old log files are compressed to save space.
Docker
Because Docker containers are expected to be ephemeral, Relution does not write log files when run inside a container. To get logs from a running container use the docker logs command.
We recommend to set up a logging infrastructure to ensure logs are properly collected and archived to help with troubleshooting in case of issues.
Linux
If Relution is installed in the default directory /opt/relution, you can find the logs in /opt/relution/log. The most recent log file is named relution.log, and archived log files are named relution.log.<date>.gz. If Relution is installed in a different location, the log directory will be relative to its installation directory.
Windows
If Relution is installed in the default directory C:\Program Files\Relution, you can find logs in C:\Program Files\Relution\log. The most recent log file is named relution.log, and archived log files are named relution.log.<date>.gz. If Relution is installed in a different location, the log directory will be relative to its installation directory.
Activation of the system portal
In the application.yml in the Relution directory, add this section:
relution:
  spring-boot-admin:
    enabled: true
Be sure to indent each line here (two spaces per level). It is recommended to deactivate the system portal again after finishing the work.
Activation of the DEBUG Log in the System Portal
log in to Relution as system administrator. The default username is
admingo to
System Portalin the system menu.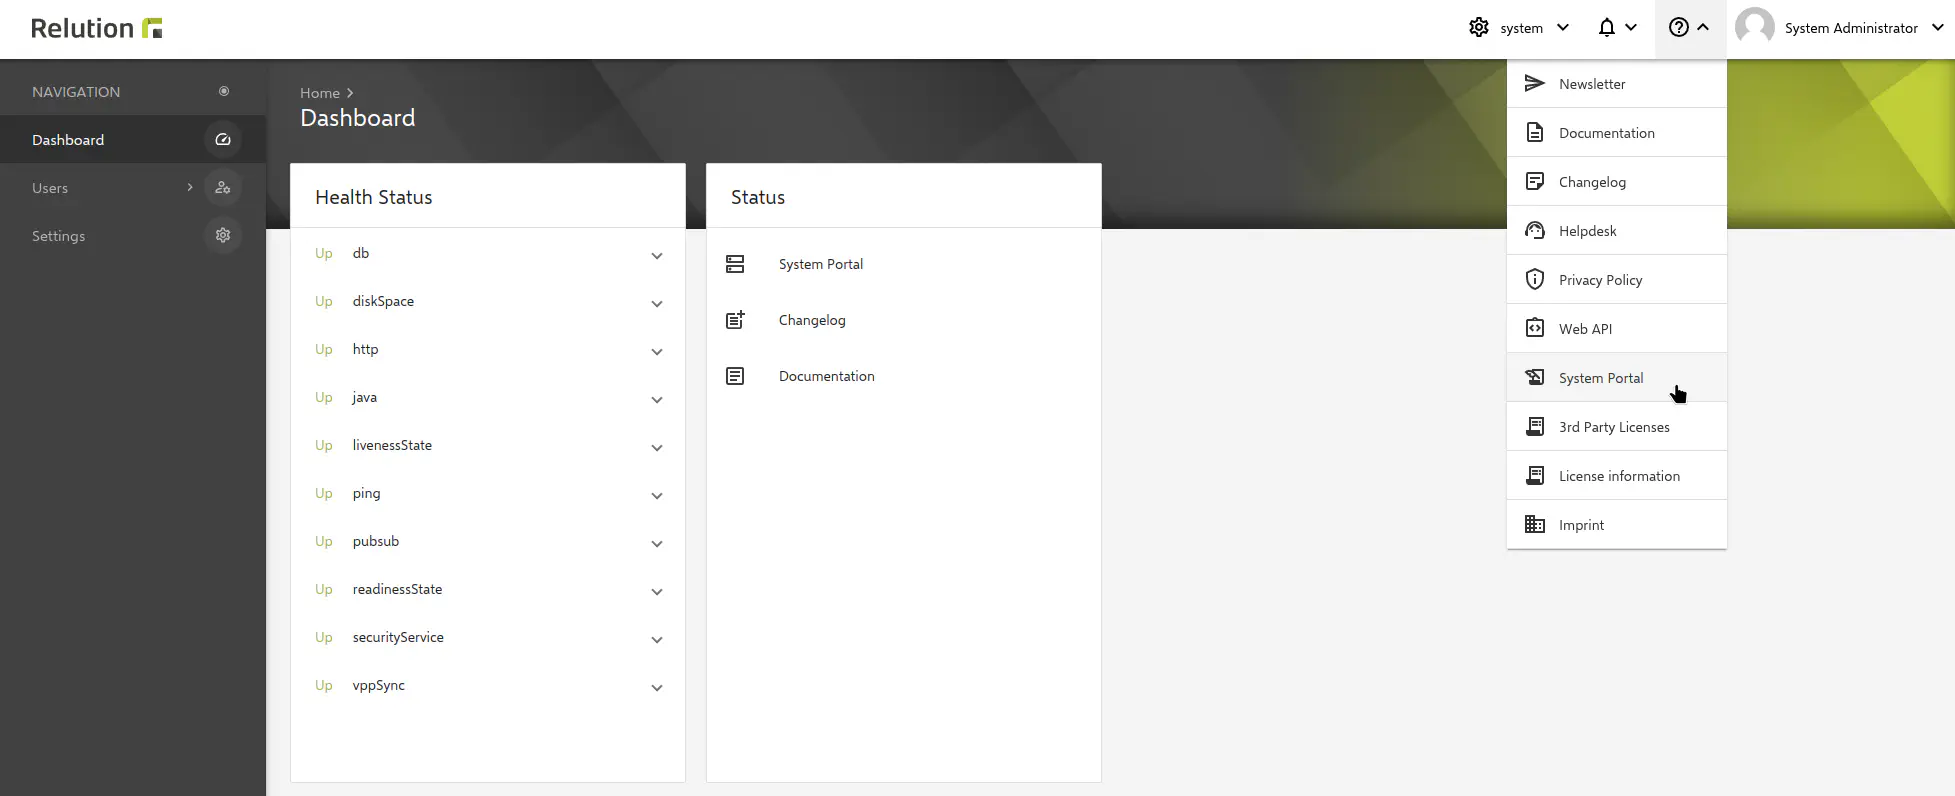
then you can call associated instance. To do this, click on the box and not directly on the green link.
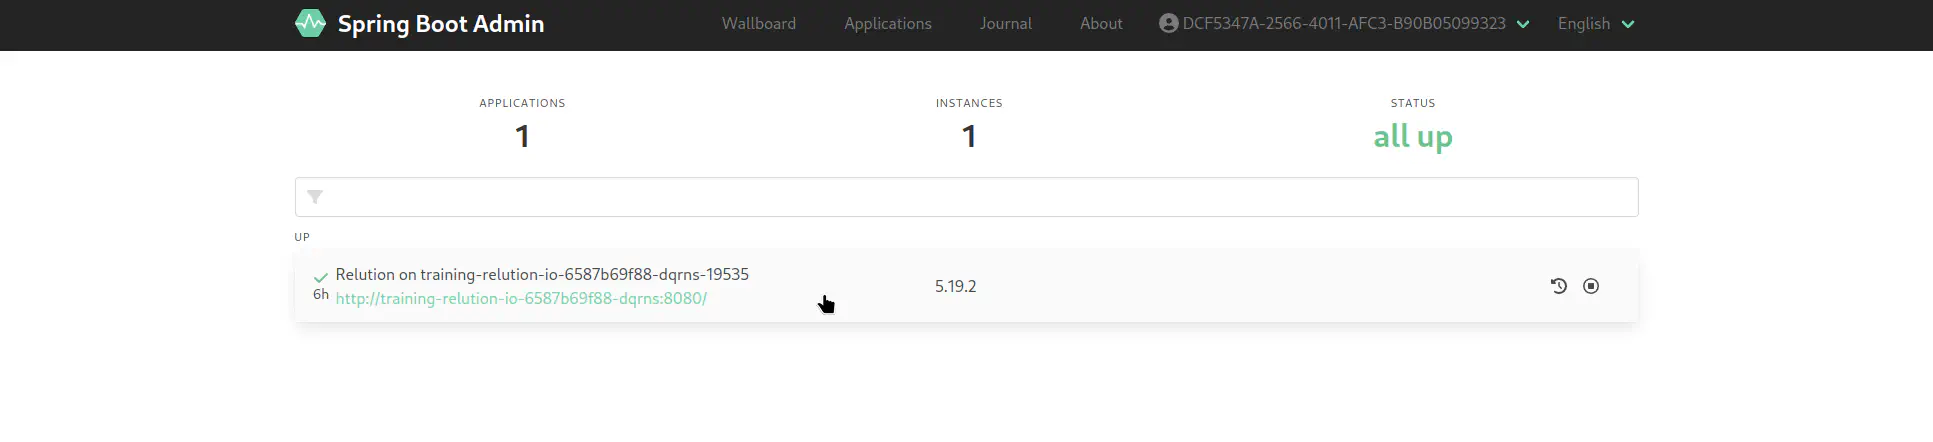
switch to the
Loggersection.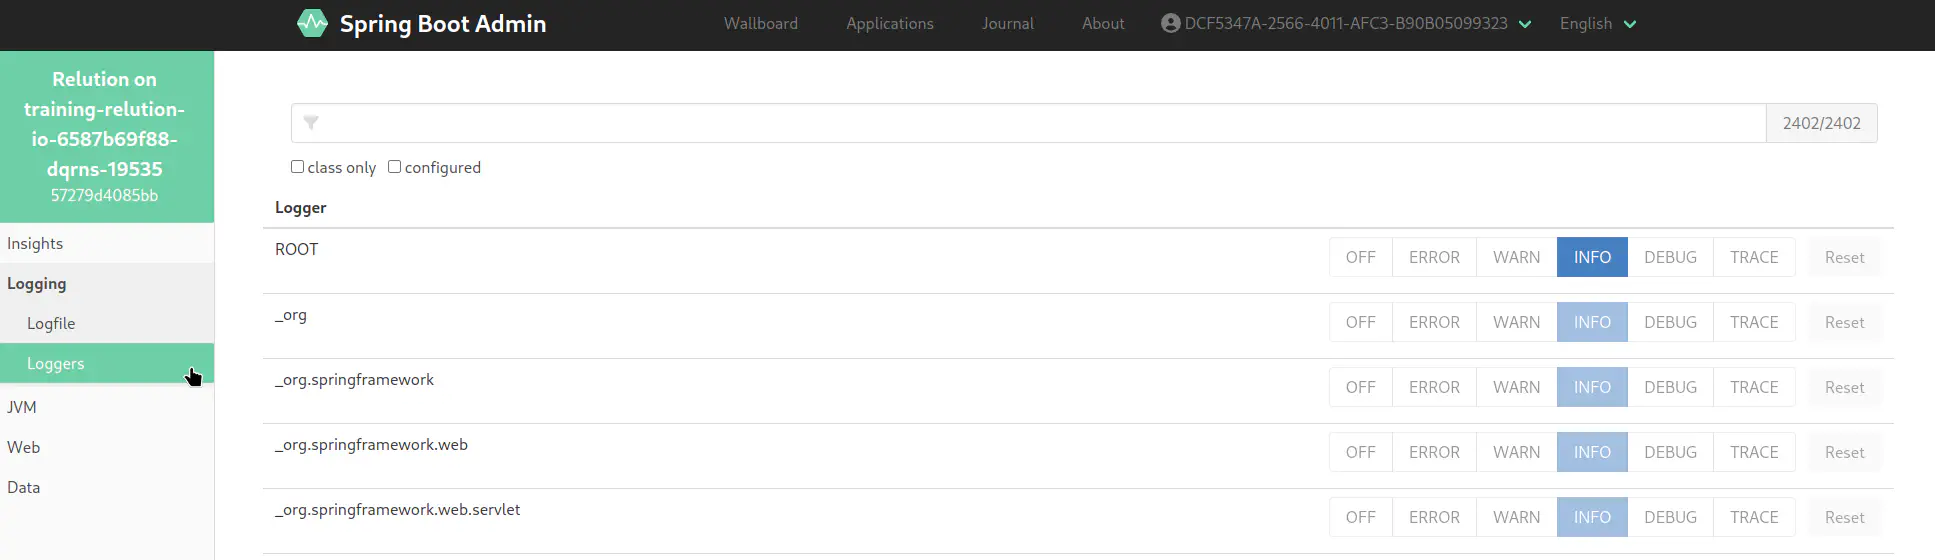
use the search to set the corresponding
LoggertoDEBUG.ROOTactivates allLoggersand should therefore only be used in exceptional cases, as a lot of content is generated quickly. In the example theAppleMDMResourcehas been activated.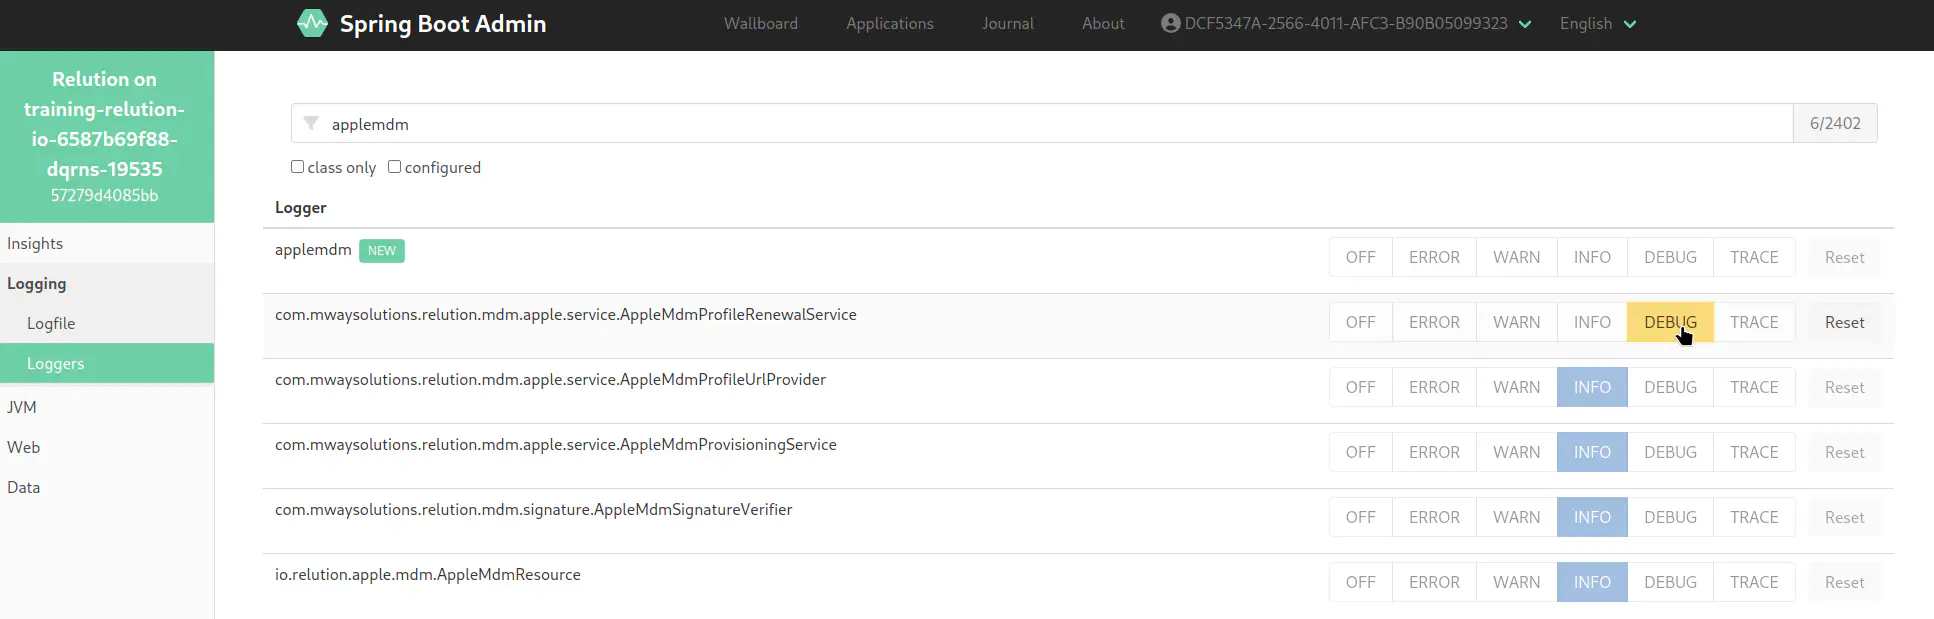
Note that the setting is directly active and you do not need to restart any services.
When restarting the Relution service or Docker container, the log will be set back to INFO.
Keeping the DEBUG log active beyond a restart
Since the DEBUG log is set back to INFO after a restart of the instance, it is not possible to log initial errors during the startup process, e.g. in the context of an LDAP connection, in the way described above. For this there is the possibility to define the log in the application.yml. This is loaded directly at startup and thus activates the DEBUG log.
Insert the following content directly into the first line at position 1.
Set ROOT to DEBUG
Note that logging at the
ROOTlevel may generate a lot of content quickly. This functionality should only be used in absolutely exceptional cases for short analysis activities. Note that there can be significant performance degradation here even with small installations.
It is recommended to activate one or more logs individually and targeted. To do this, simply add the individual loggers one below the other in the file:
logging.level.com.mwaysolutions: DEBUG
Multiple individual logs
com.mwaysolutions.relution.platform.security.ldap: DEBUG
com.mwaysolutions.relution.mdm.apple.service.AppleMdmResource: DEBUG
In the example, LDAP functionality and IosResource would now be enabled in the DEBUG log.
The names of the loggers and how to activate them can be found in the system portal.
Setup Loglevel with a Logging User via the Web API
As of Relution 5.18, it is possible to create a special logging user on the system organisation, which can comfortably change the log level via the Web API. This saves the manual editing of the YAML configuration file as well as a restart of the server.
1. create authorisation and user
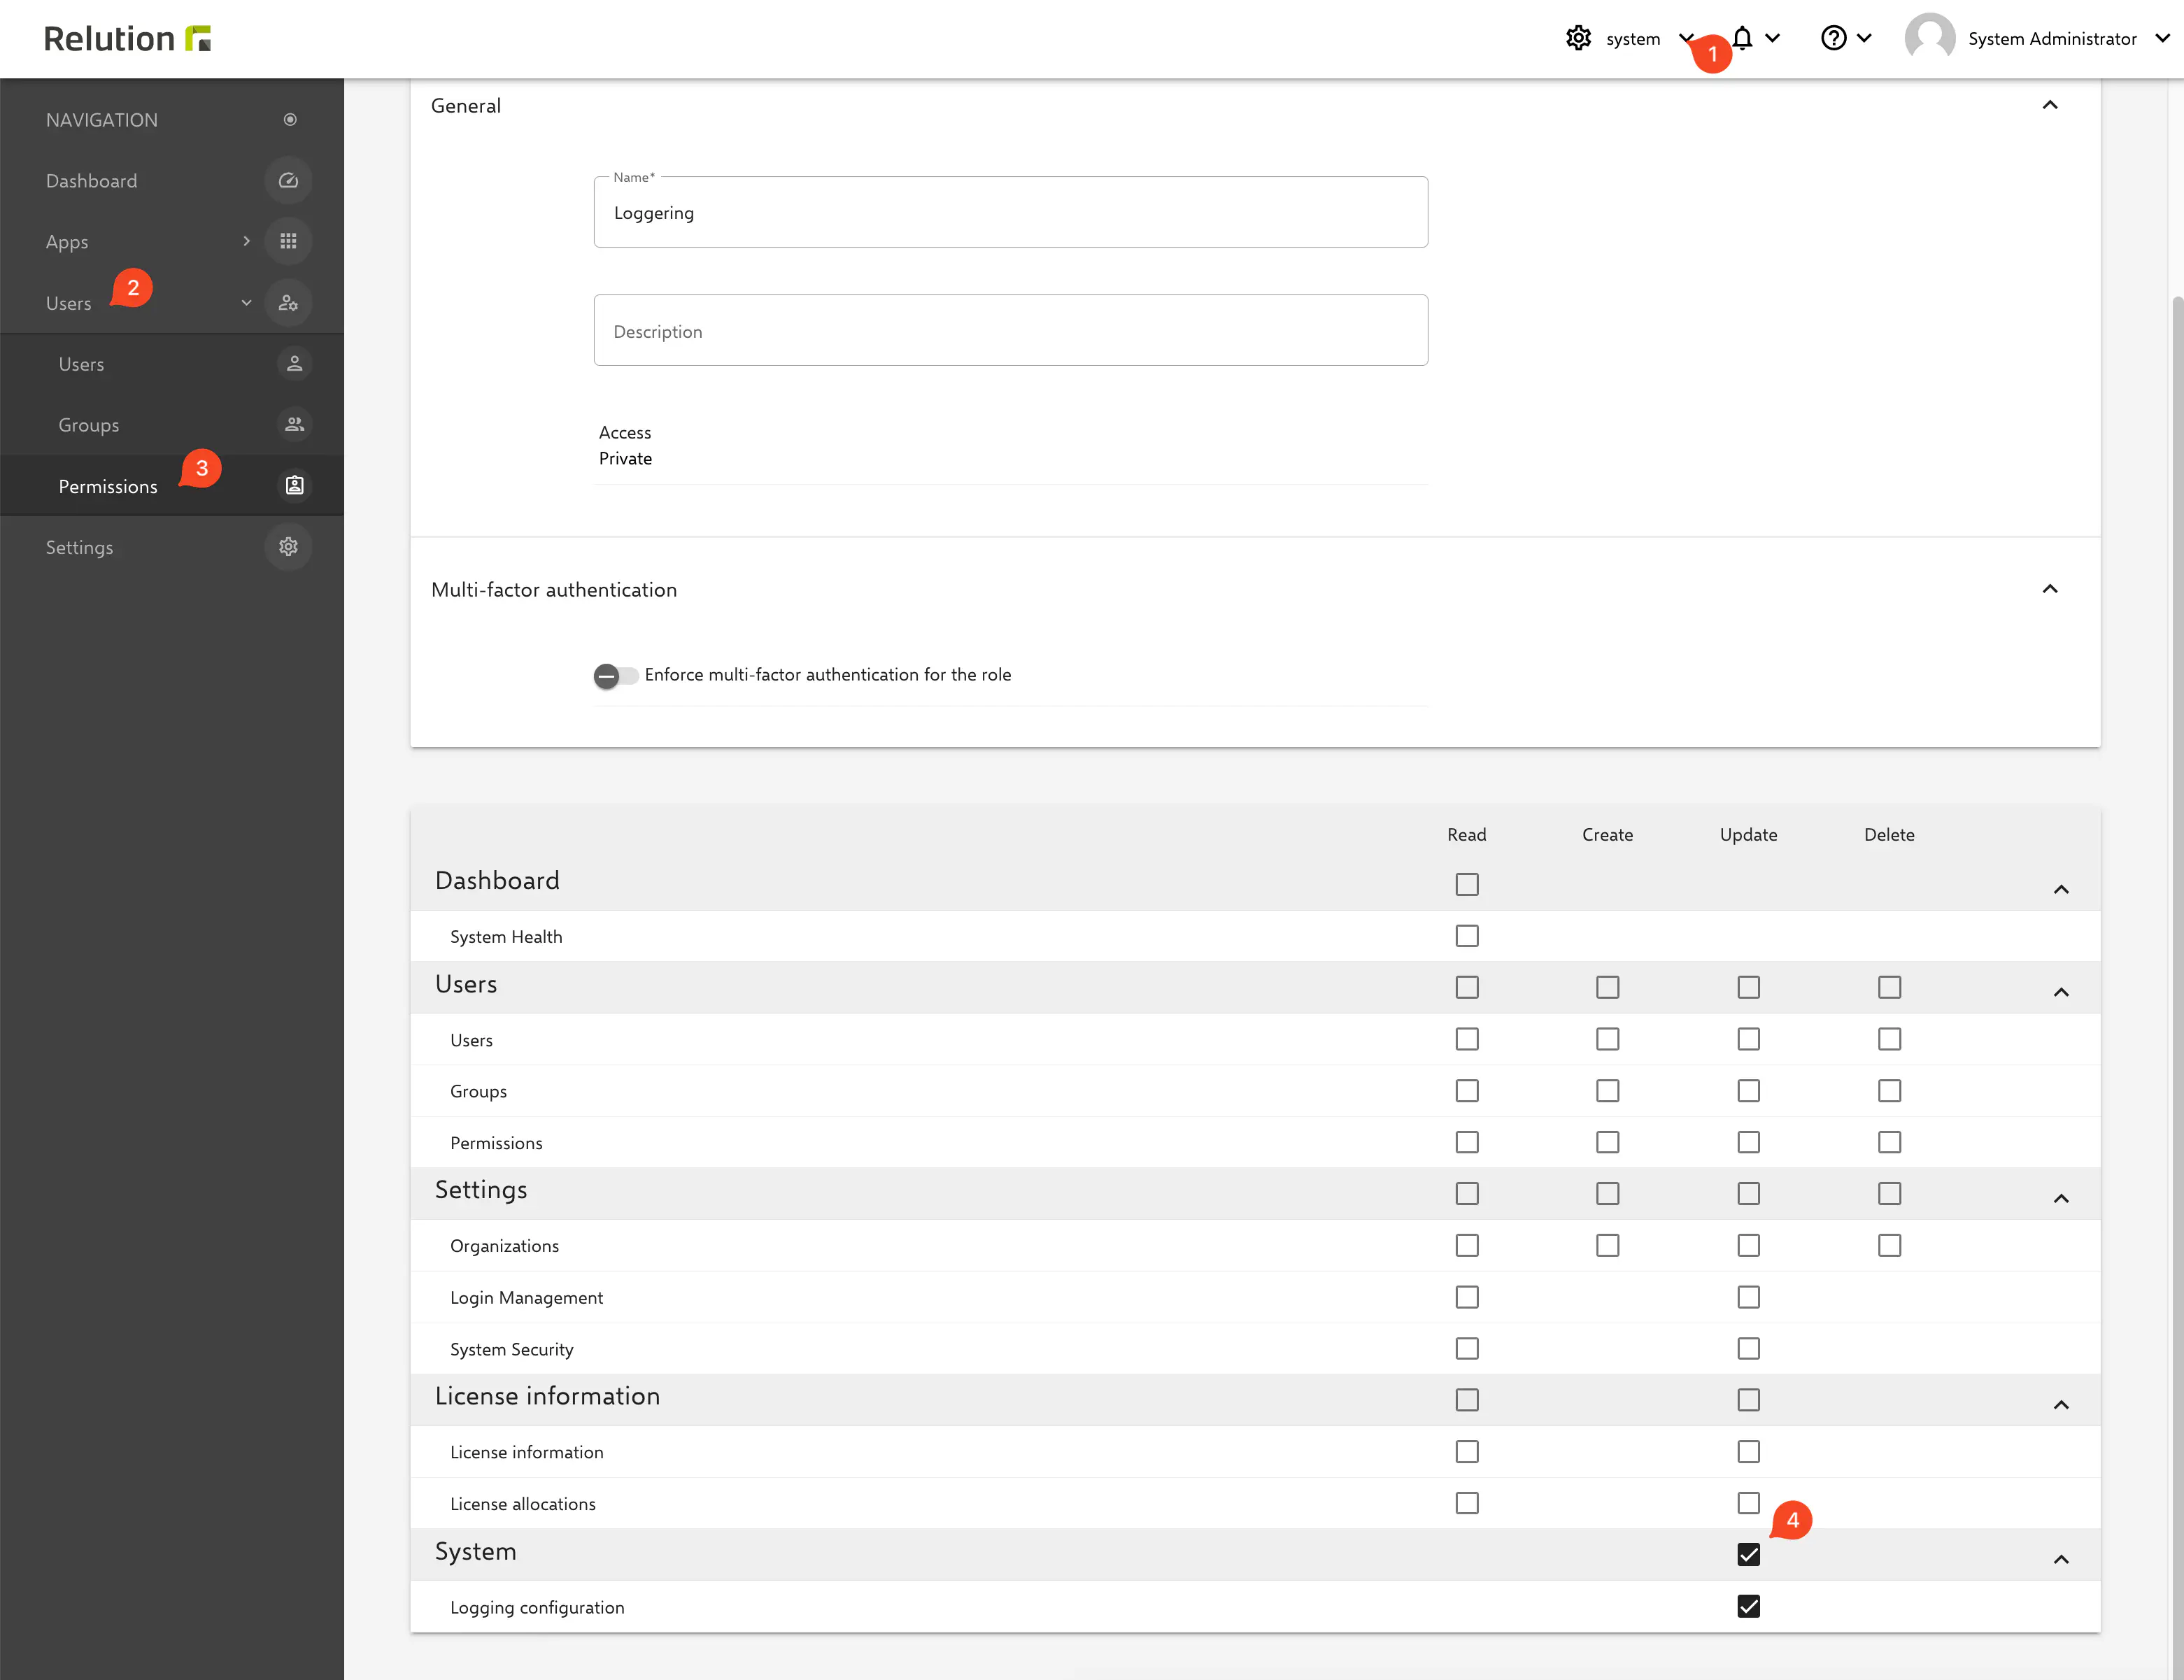
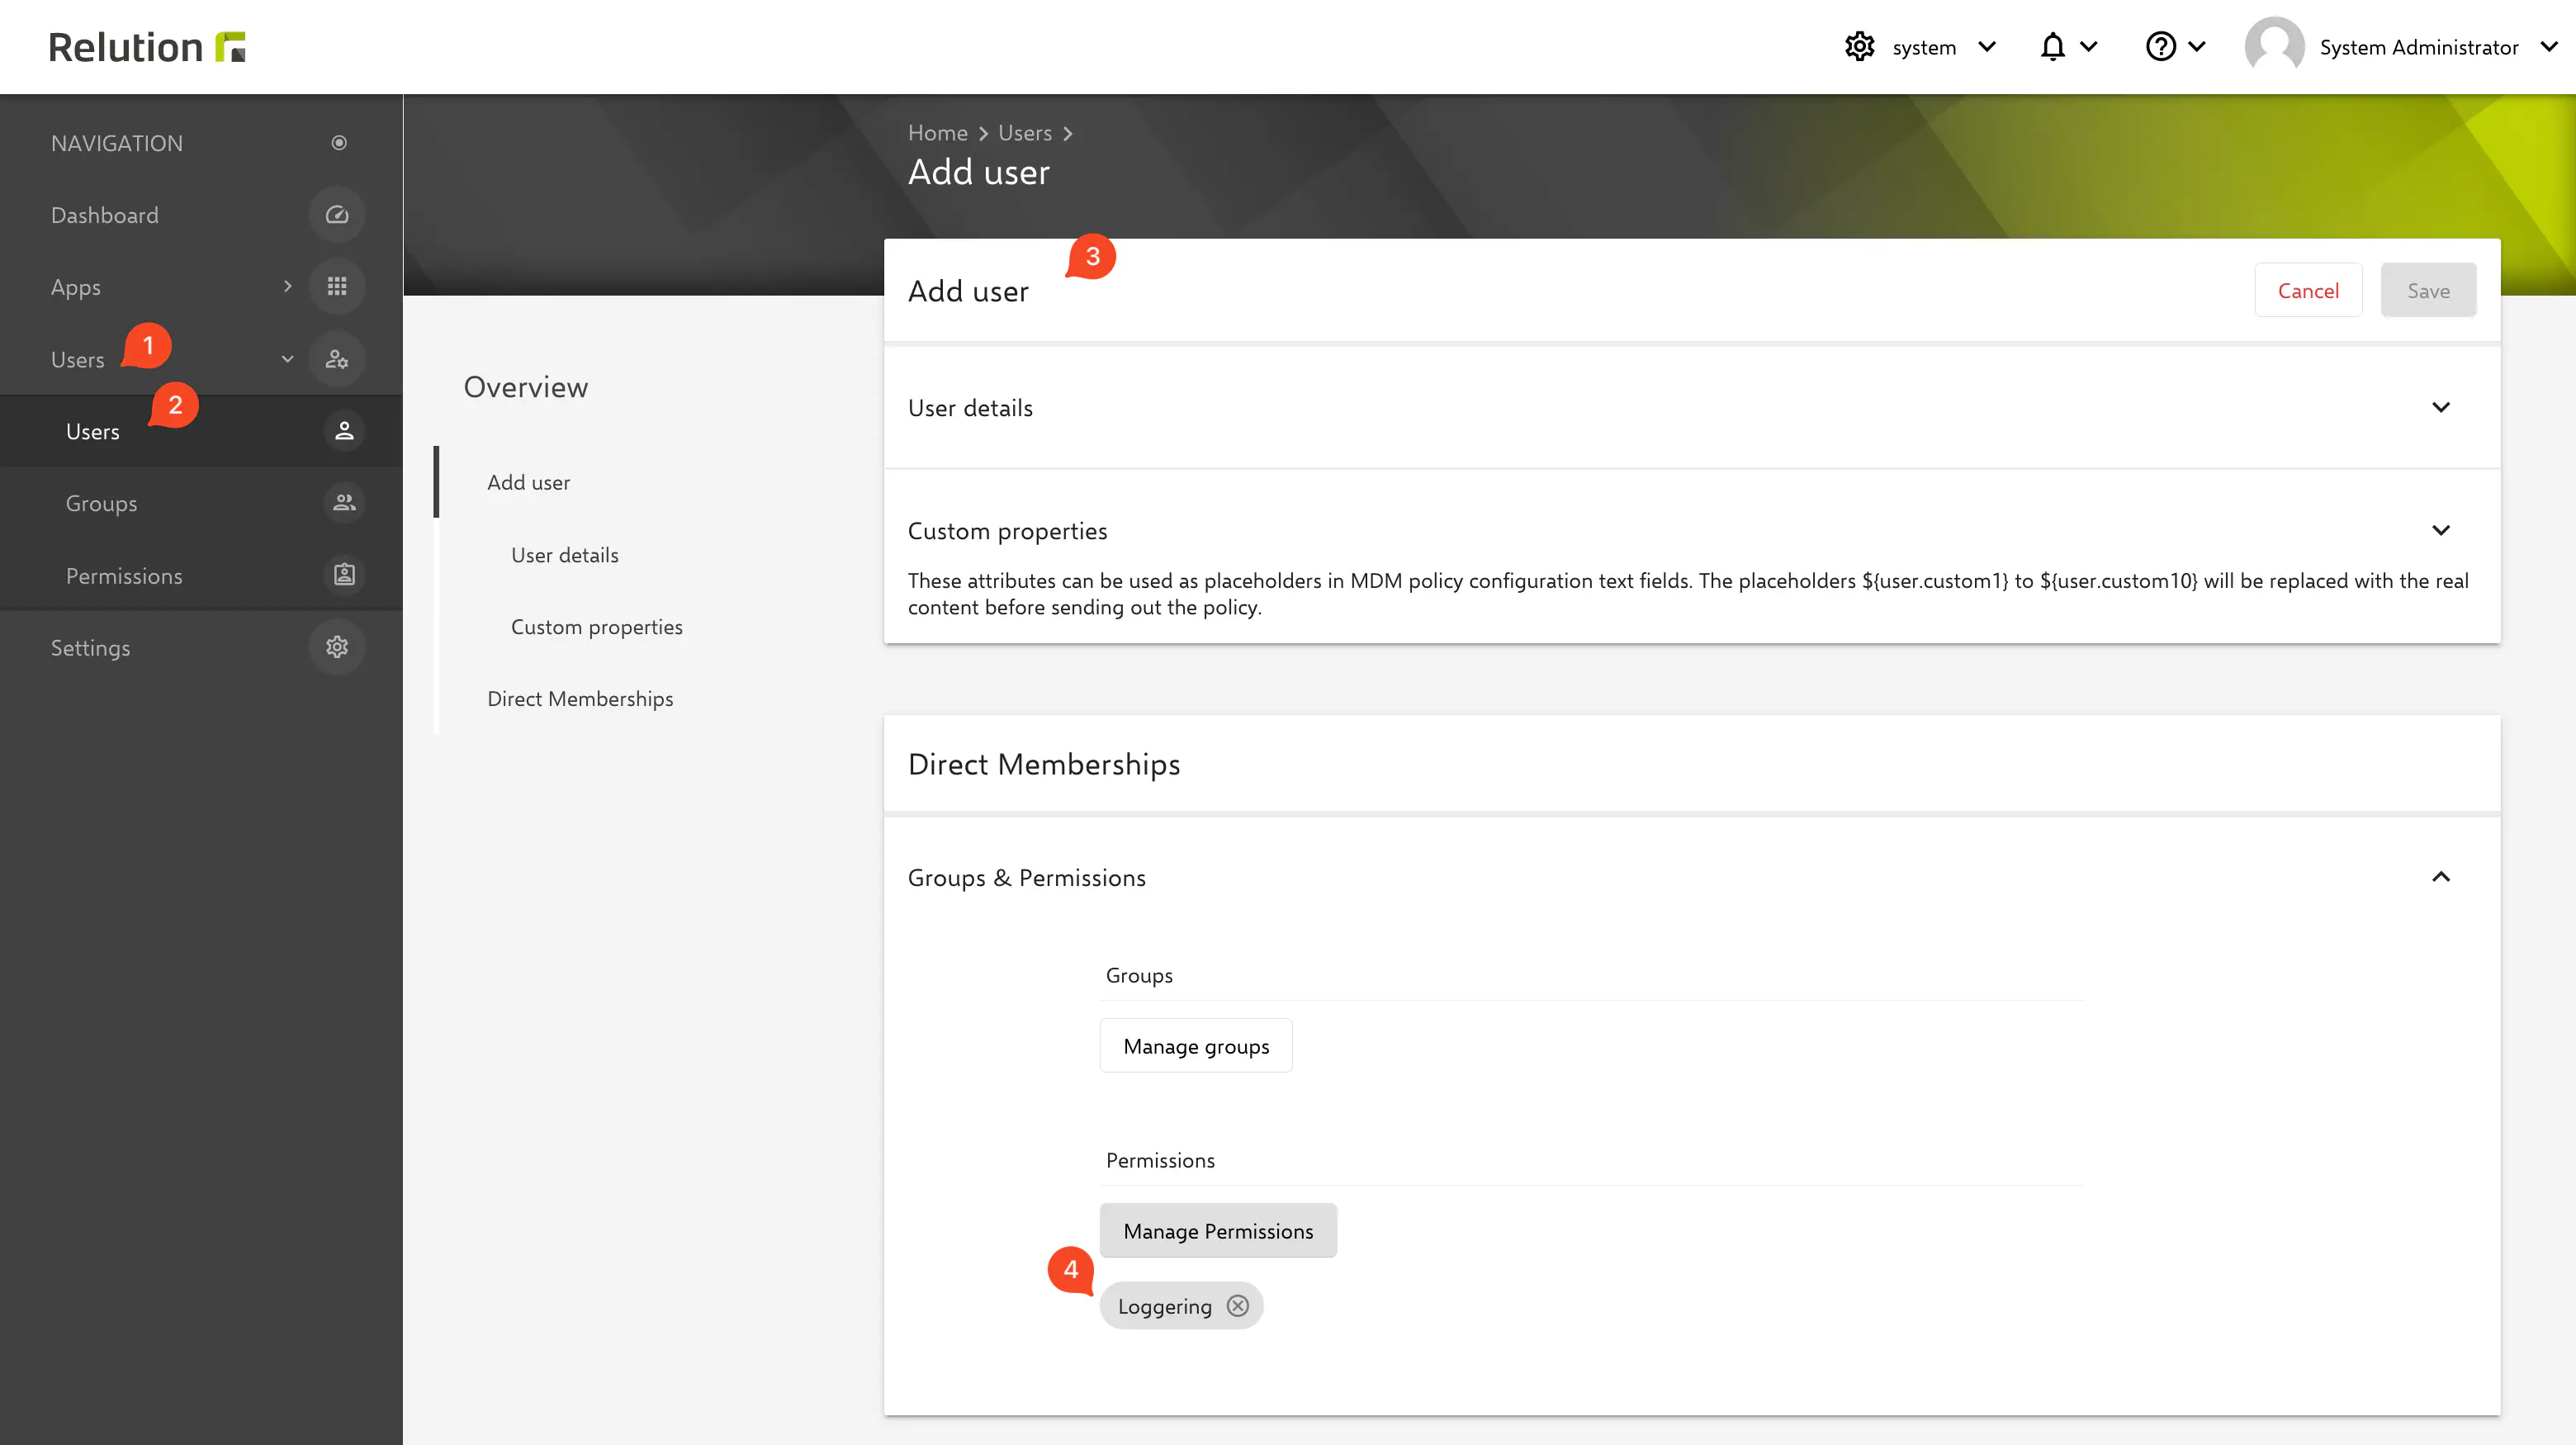
To create the logging user, a new authorisation must first be created on the system organisation, where the option “System > Logging configuration” is activated and saved. Then a new user can be created exclusively for the logging access, to which the previously created authorisation is assigned. Note: The system administrator has this authorisation by default.
2. create an Access Token
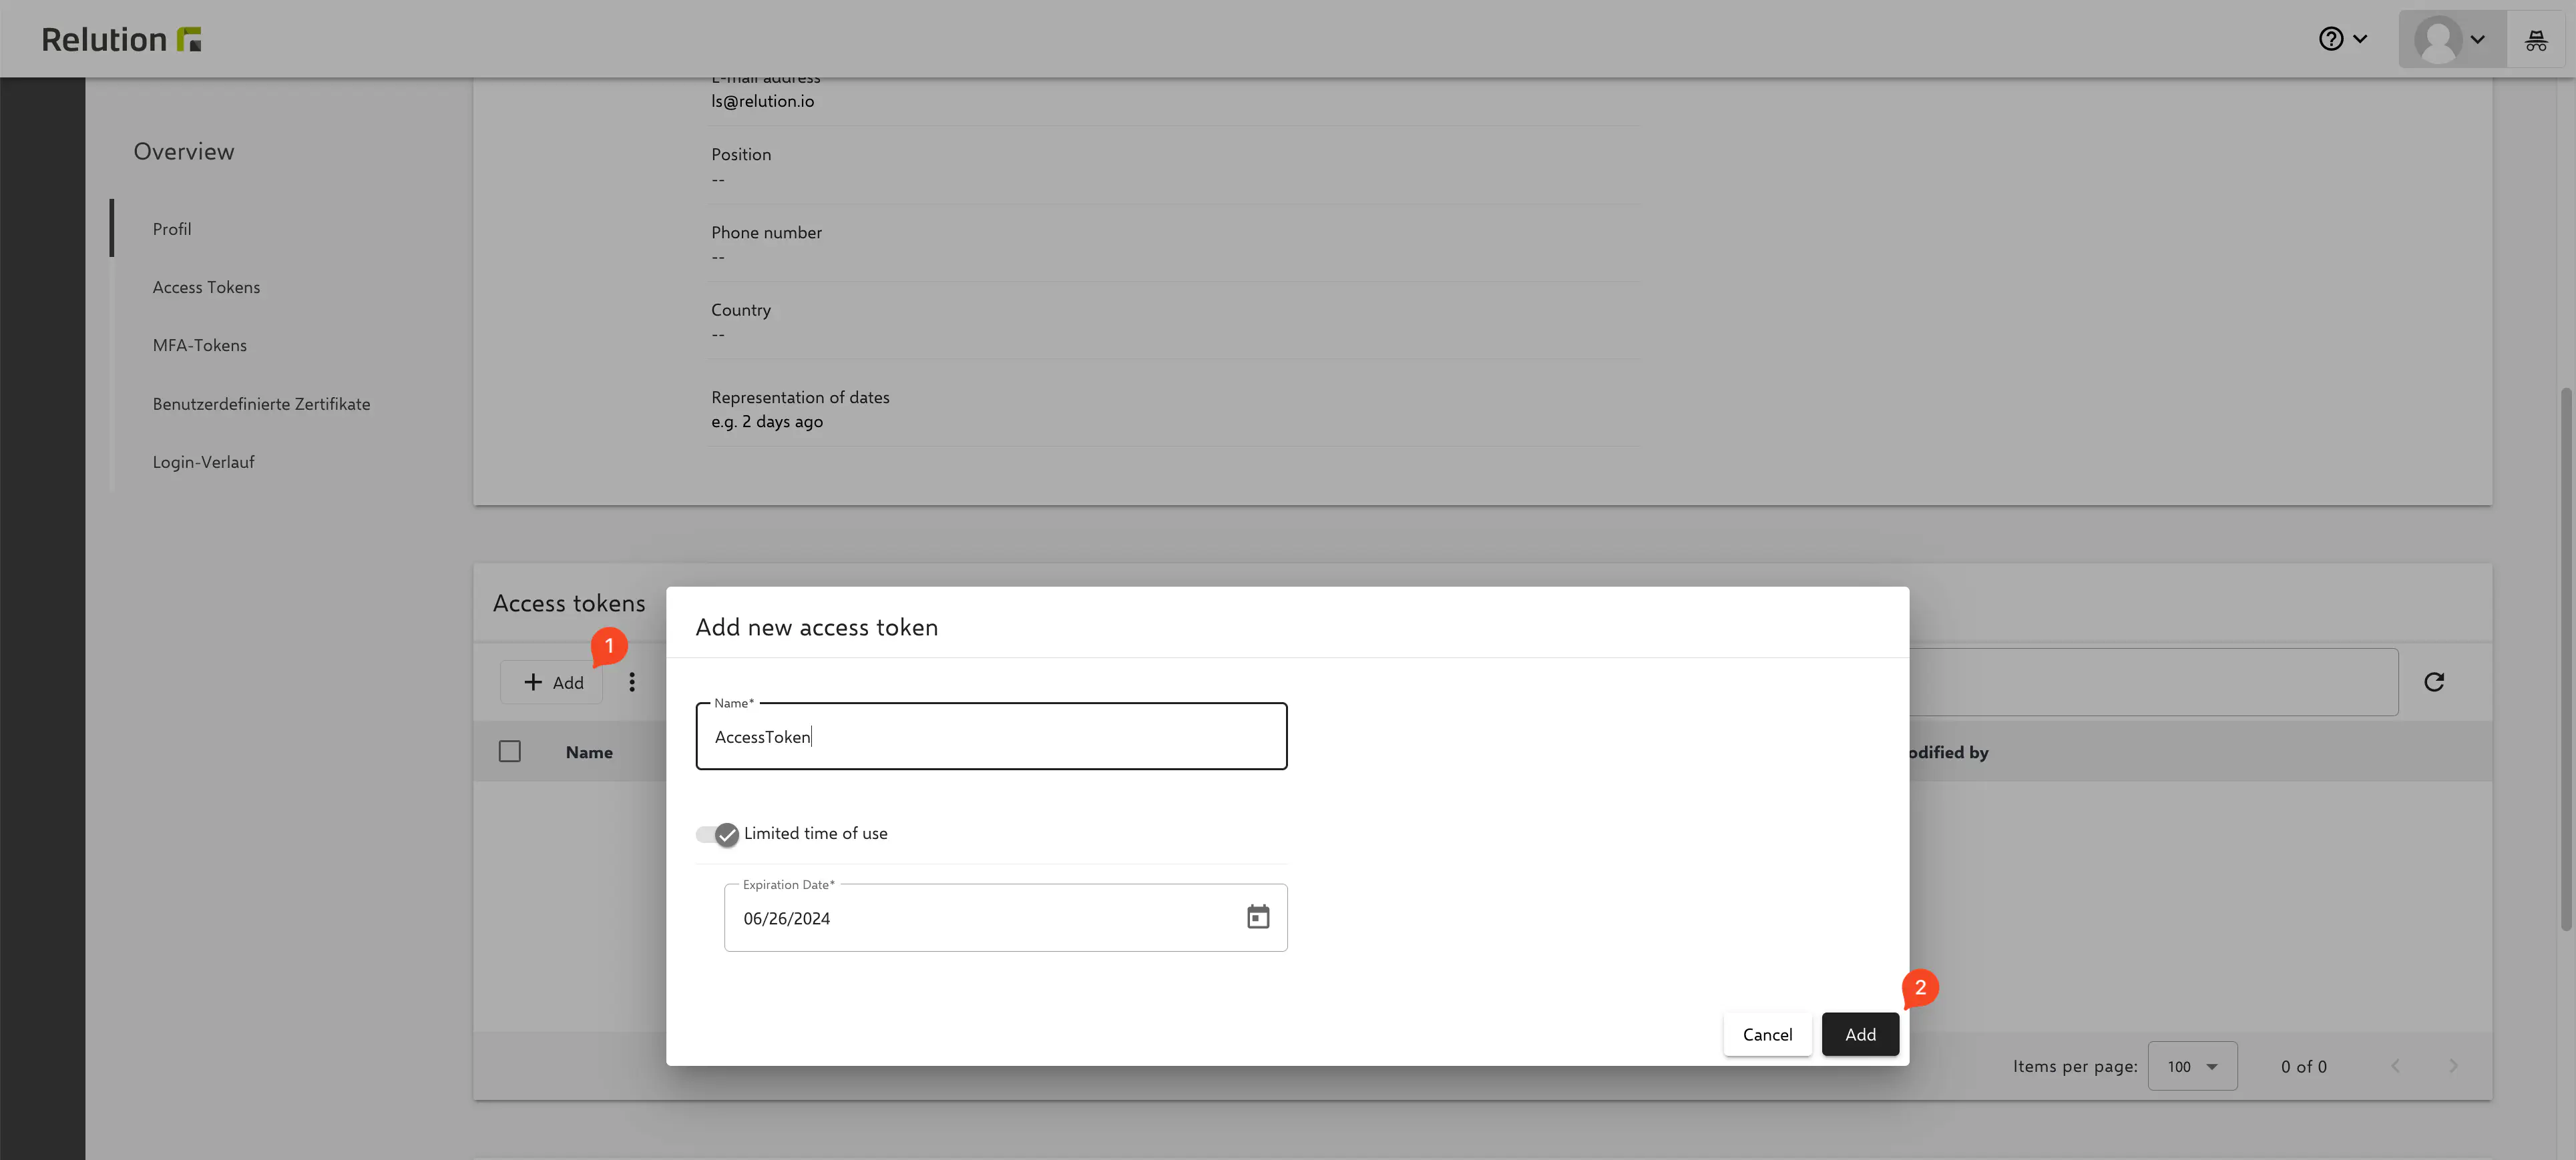
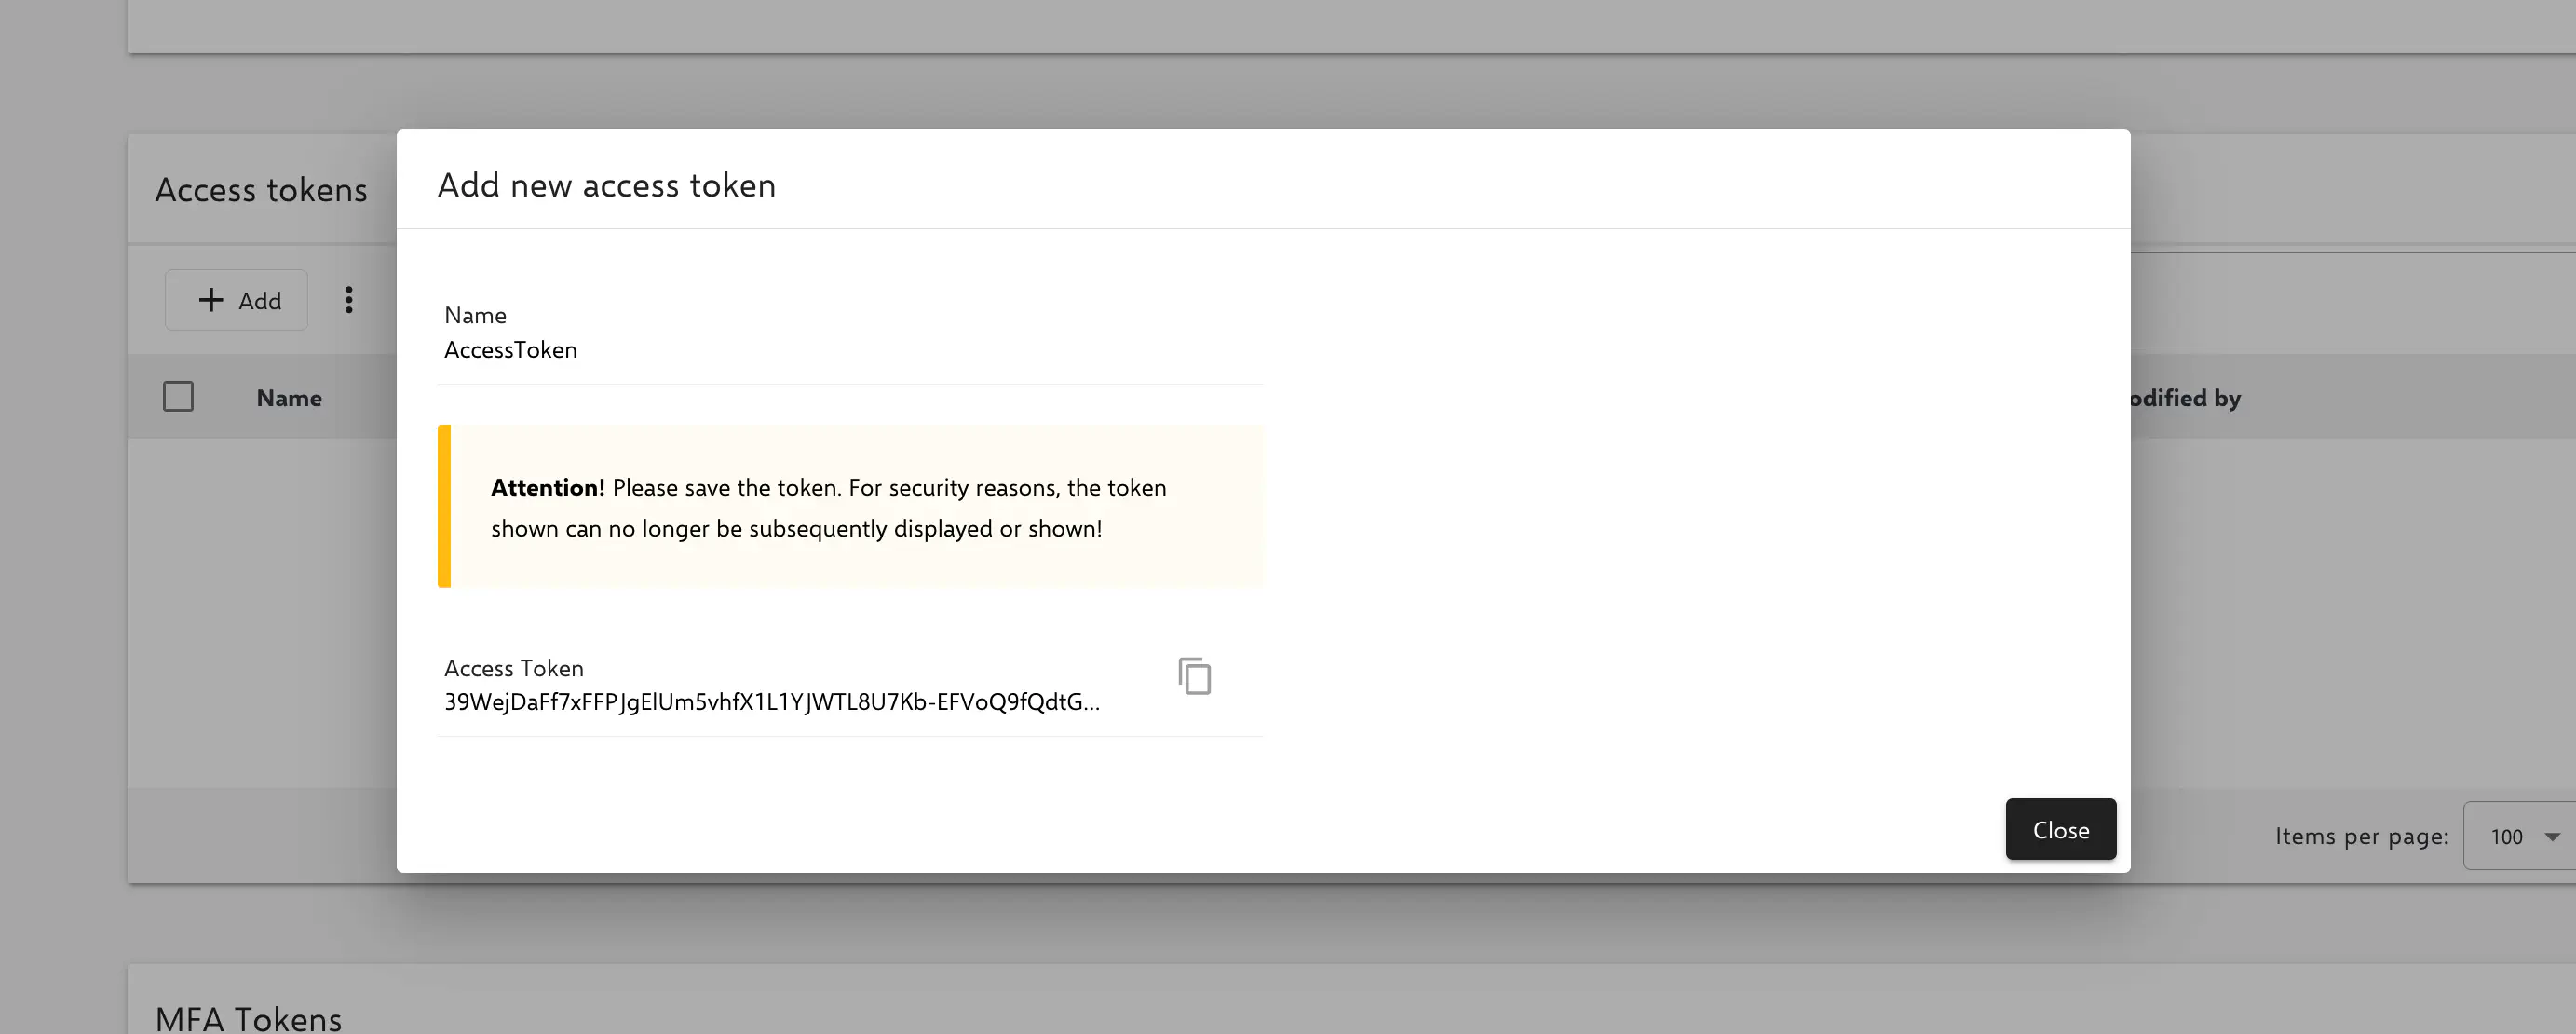
An Access Token can be created for this new user to facilitate handling. To do this, the user must first log in and create the token via the user profile. The Access Token is only displayed once, another token can be created if required.
3. controlling the log level via the Web API
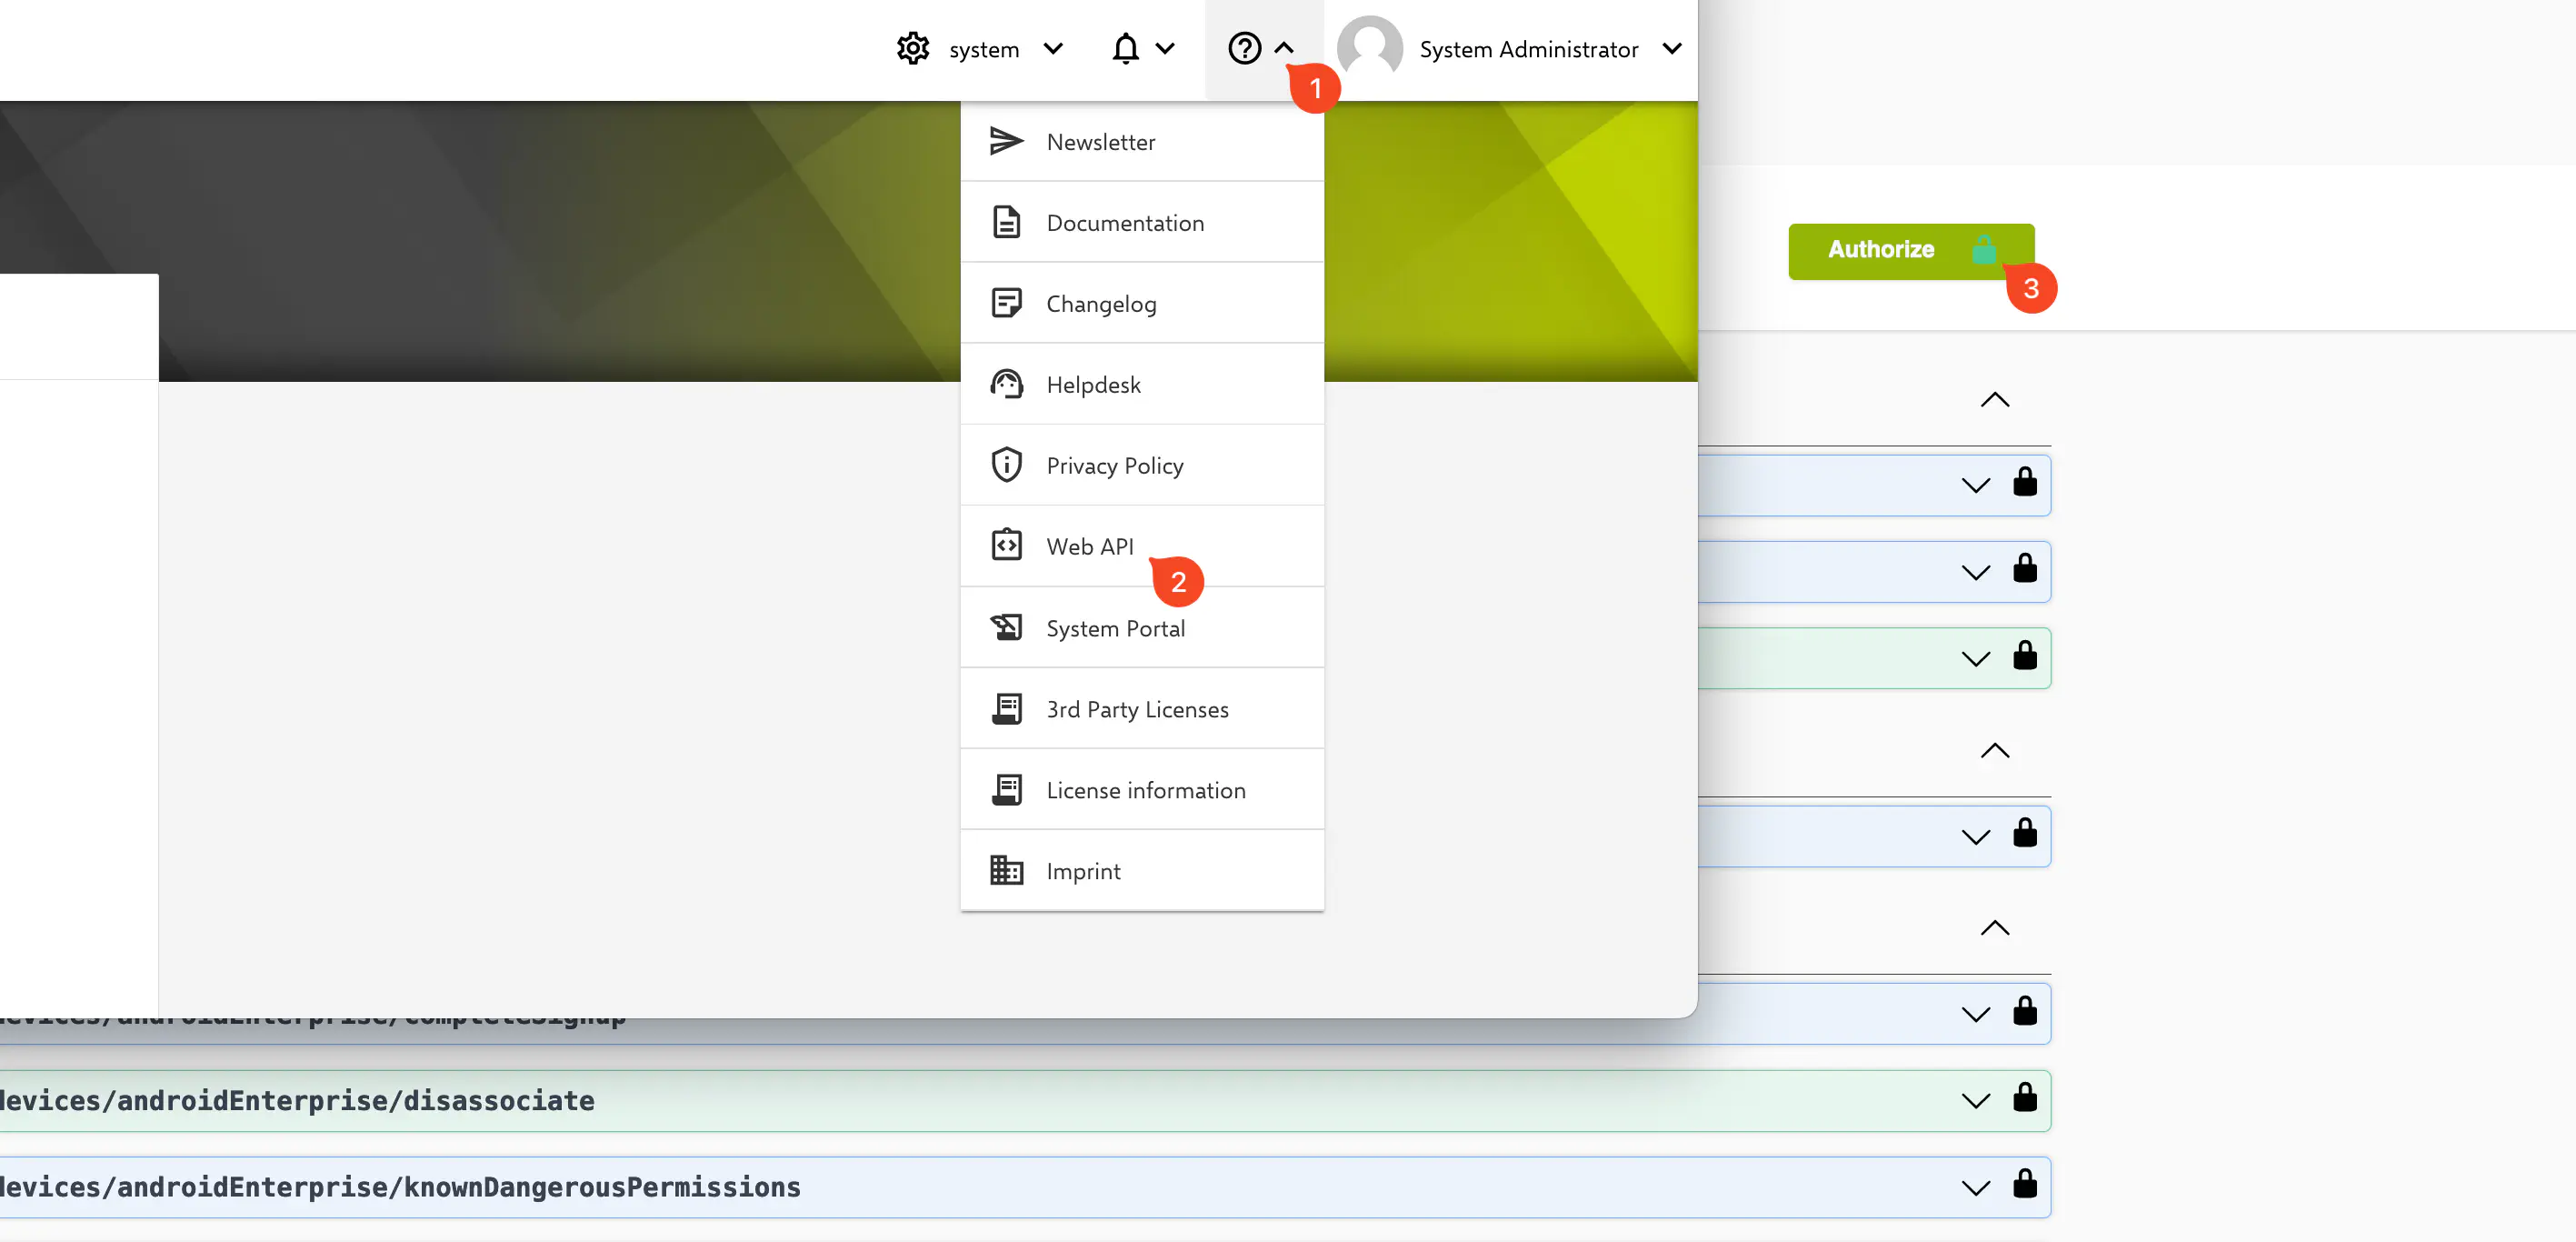
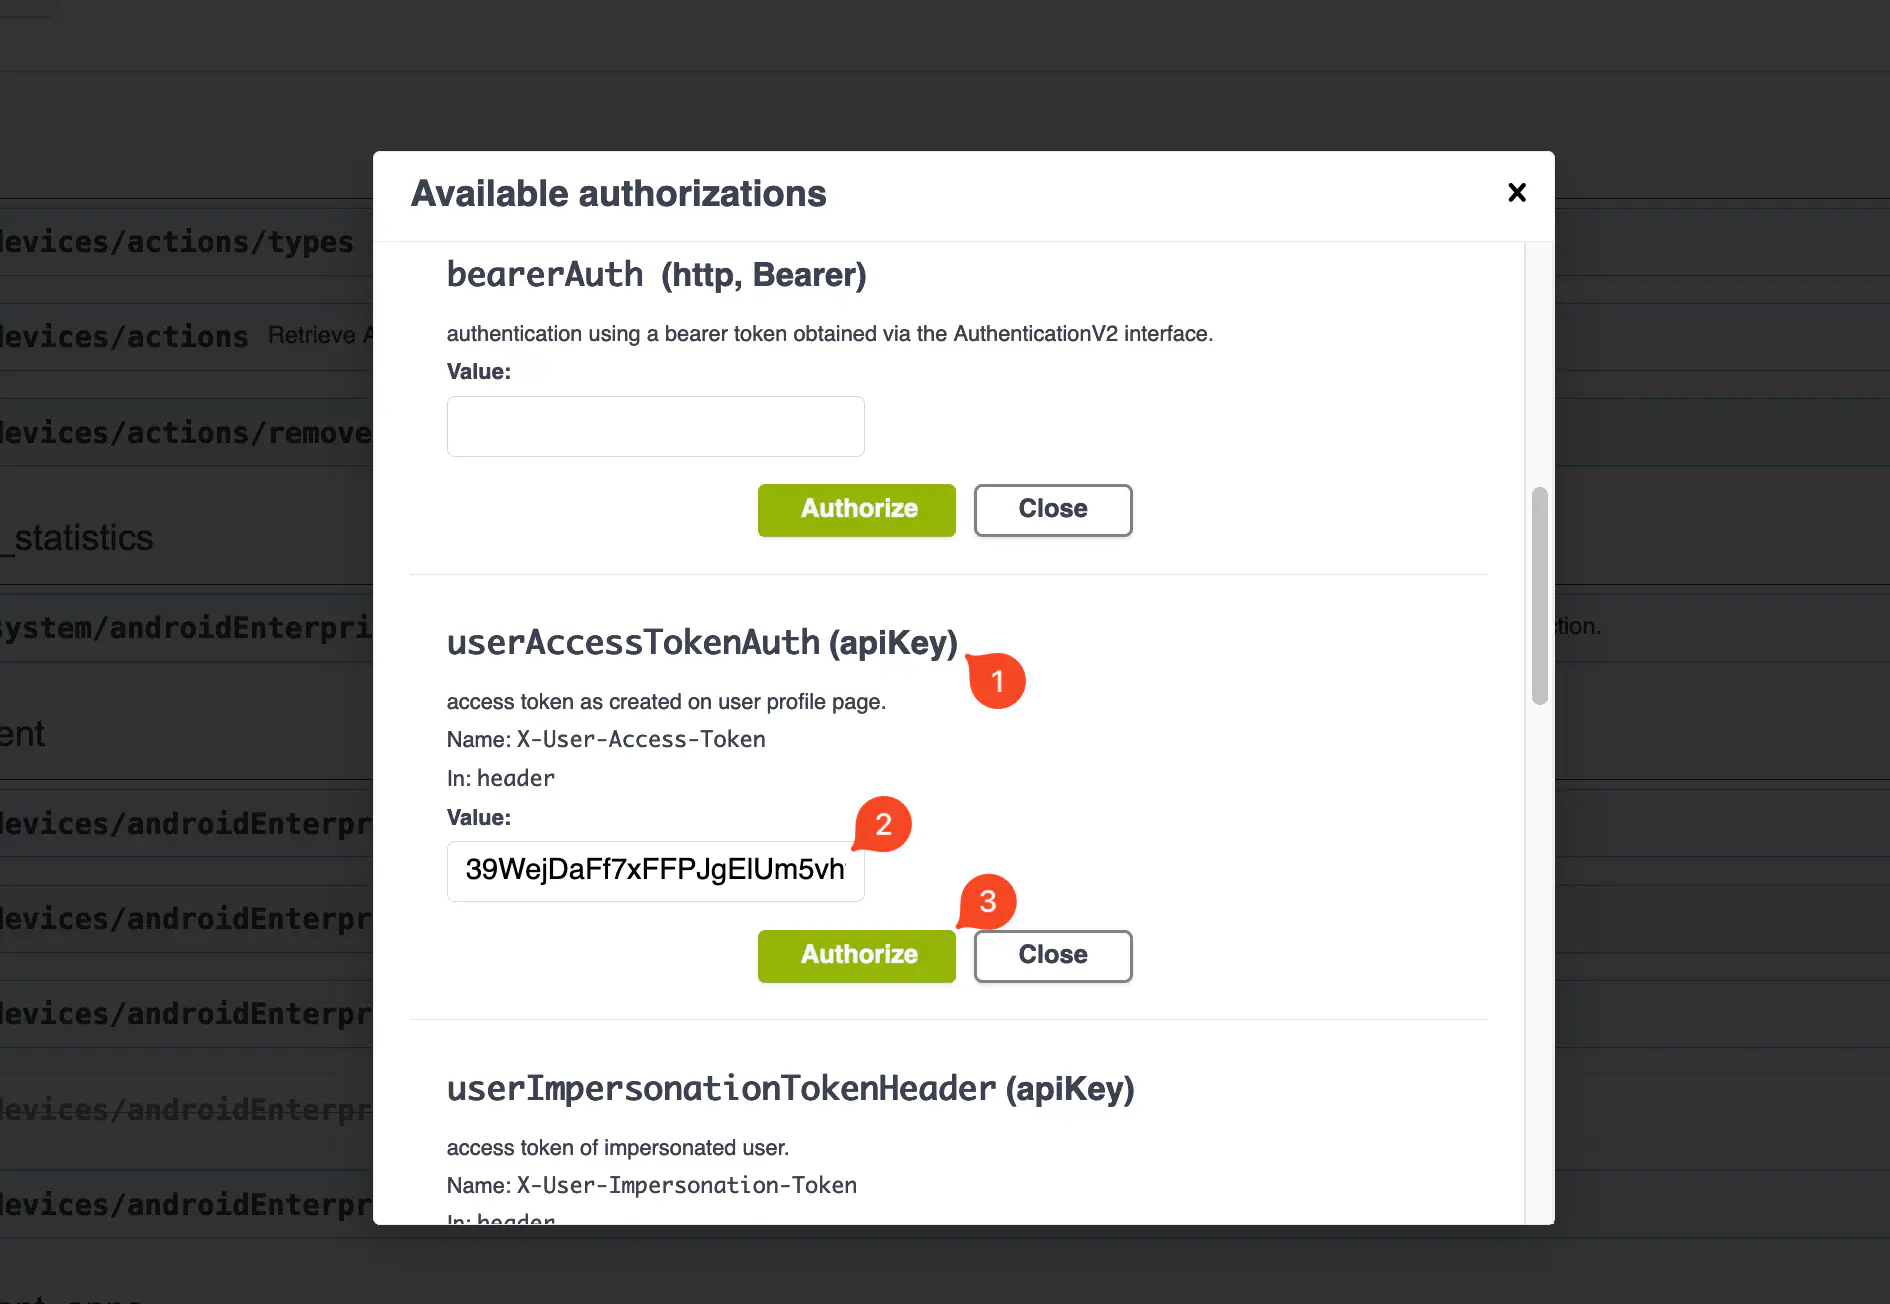
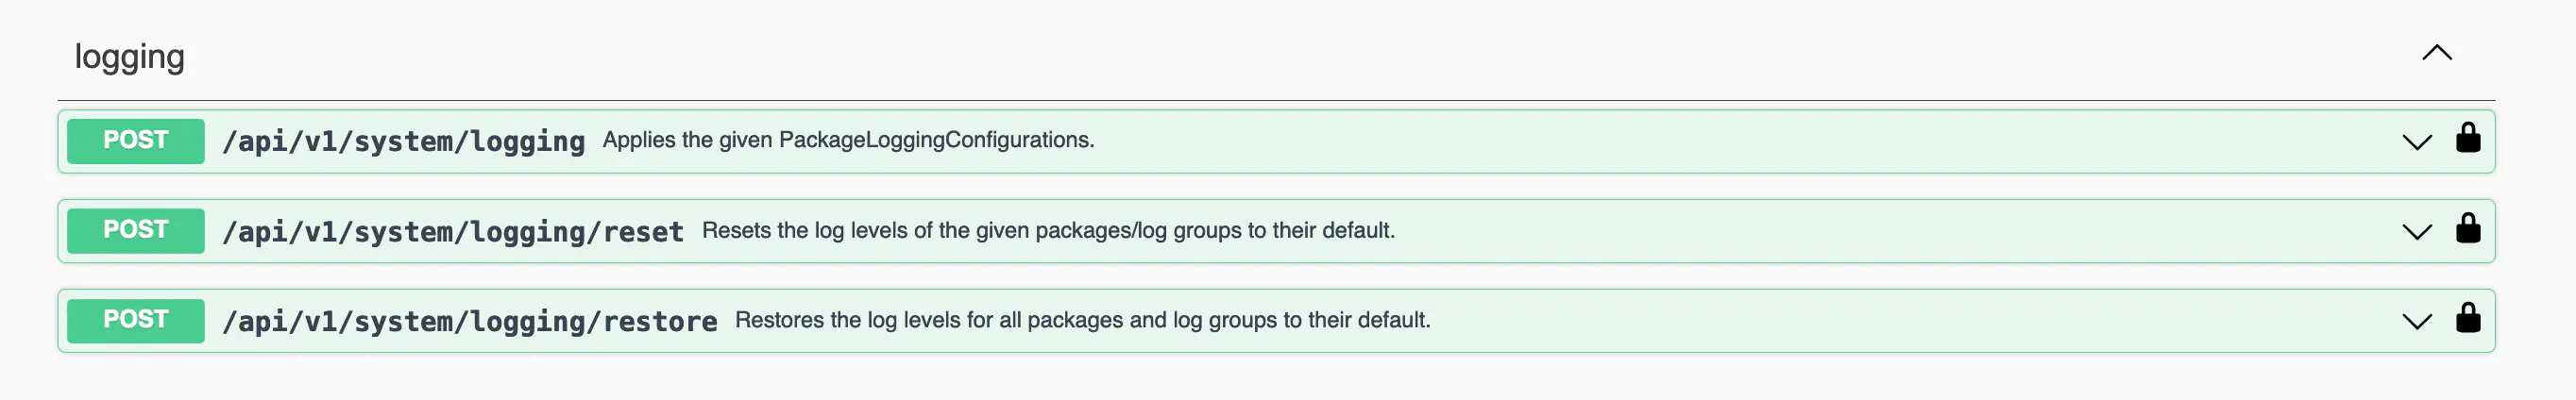
To control the log level via the Web API, the logging user can be accessed in the system organisation via the ⚙️ icon > Web API > Authorize. Here the access token of the logging user can be used to facilitate access and automatically add authentication at curl. In the item “userAccessTokenAuth” the token must be inserted and authorised. Note: Alternatively, you can log in with System System Orga Admin and skip entering the token.
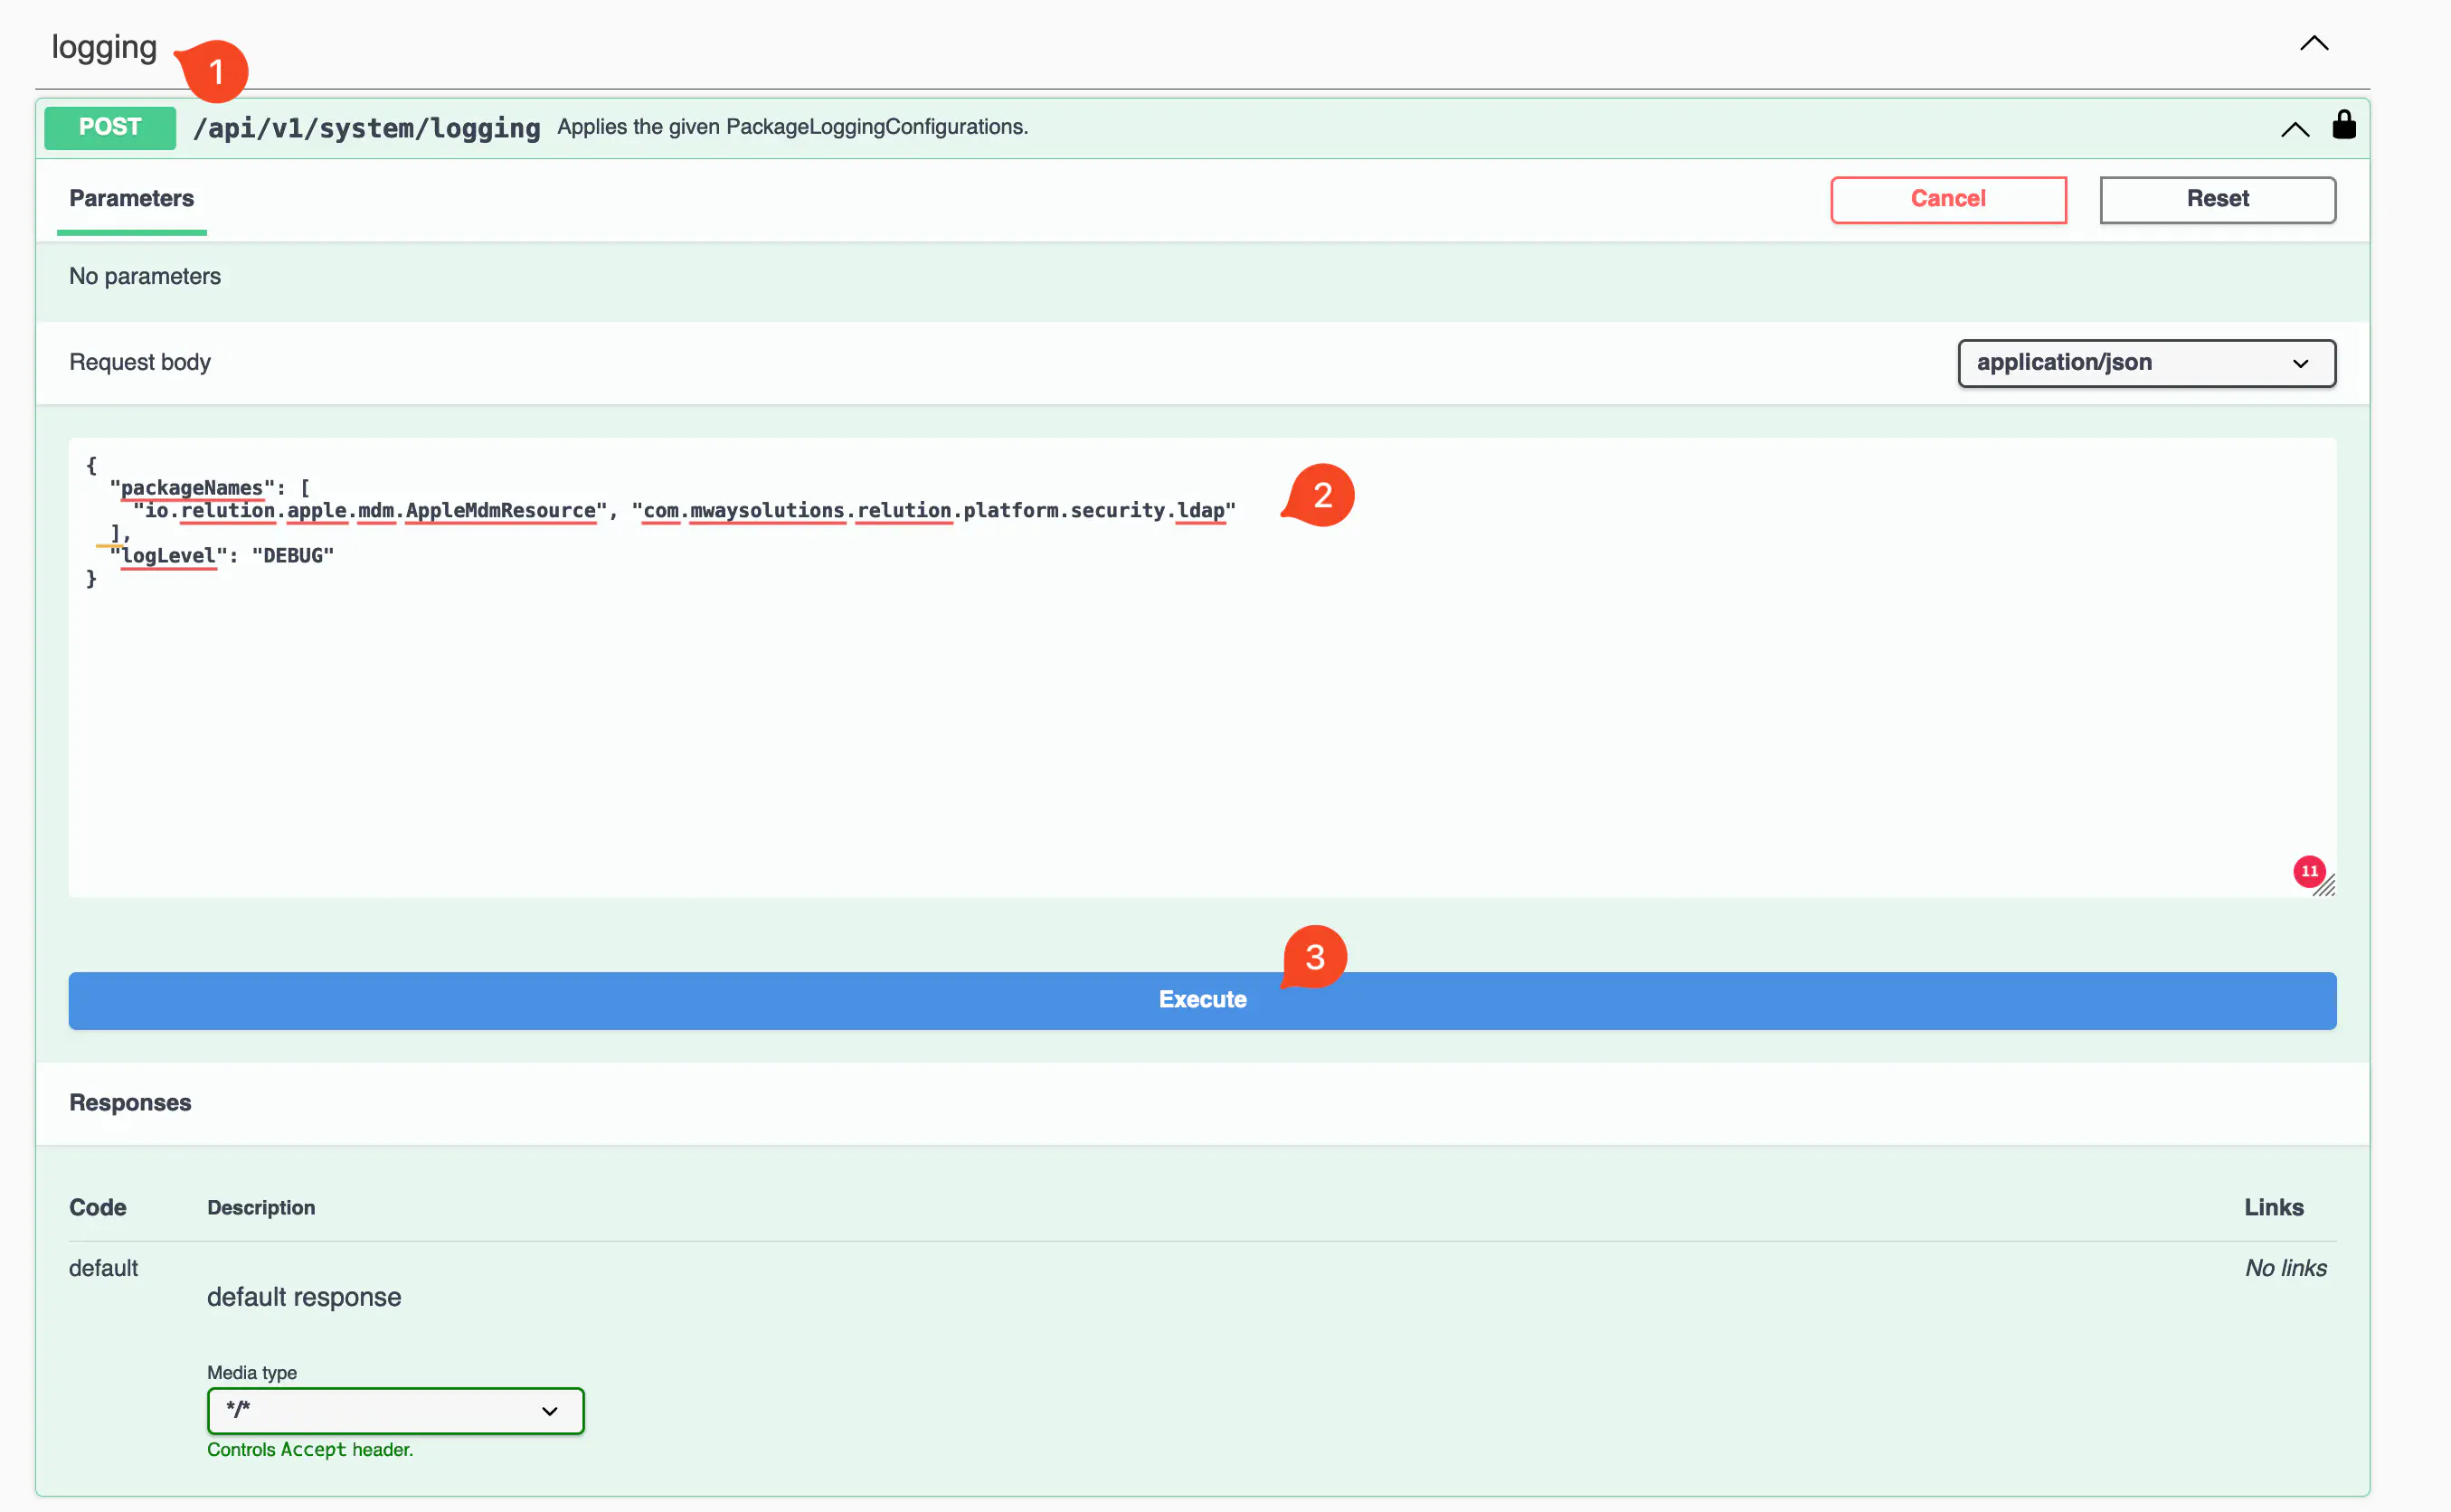
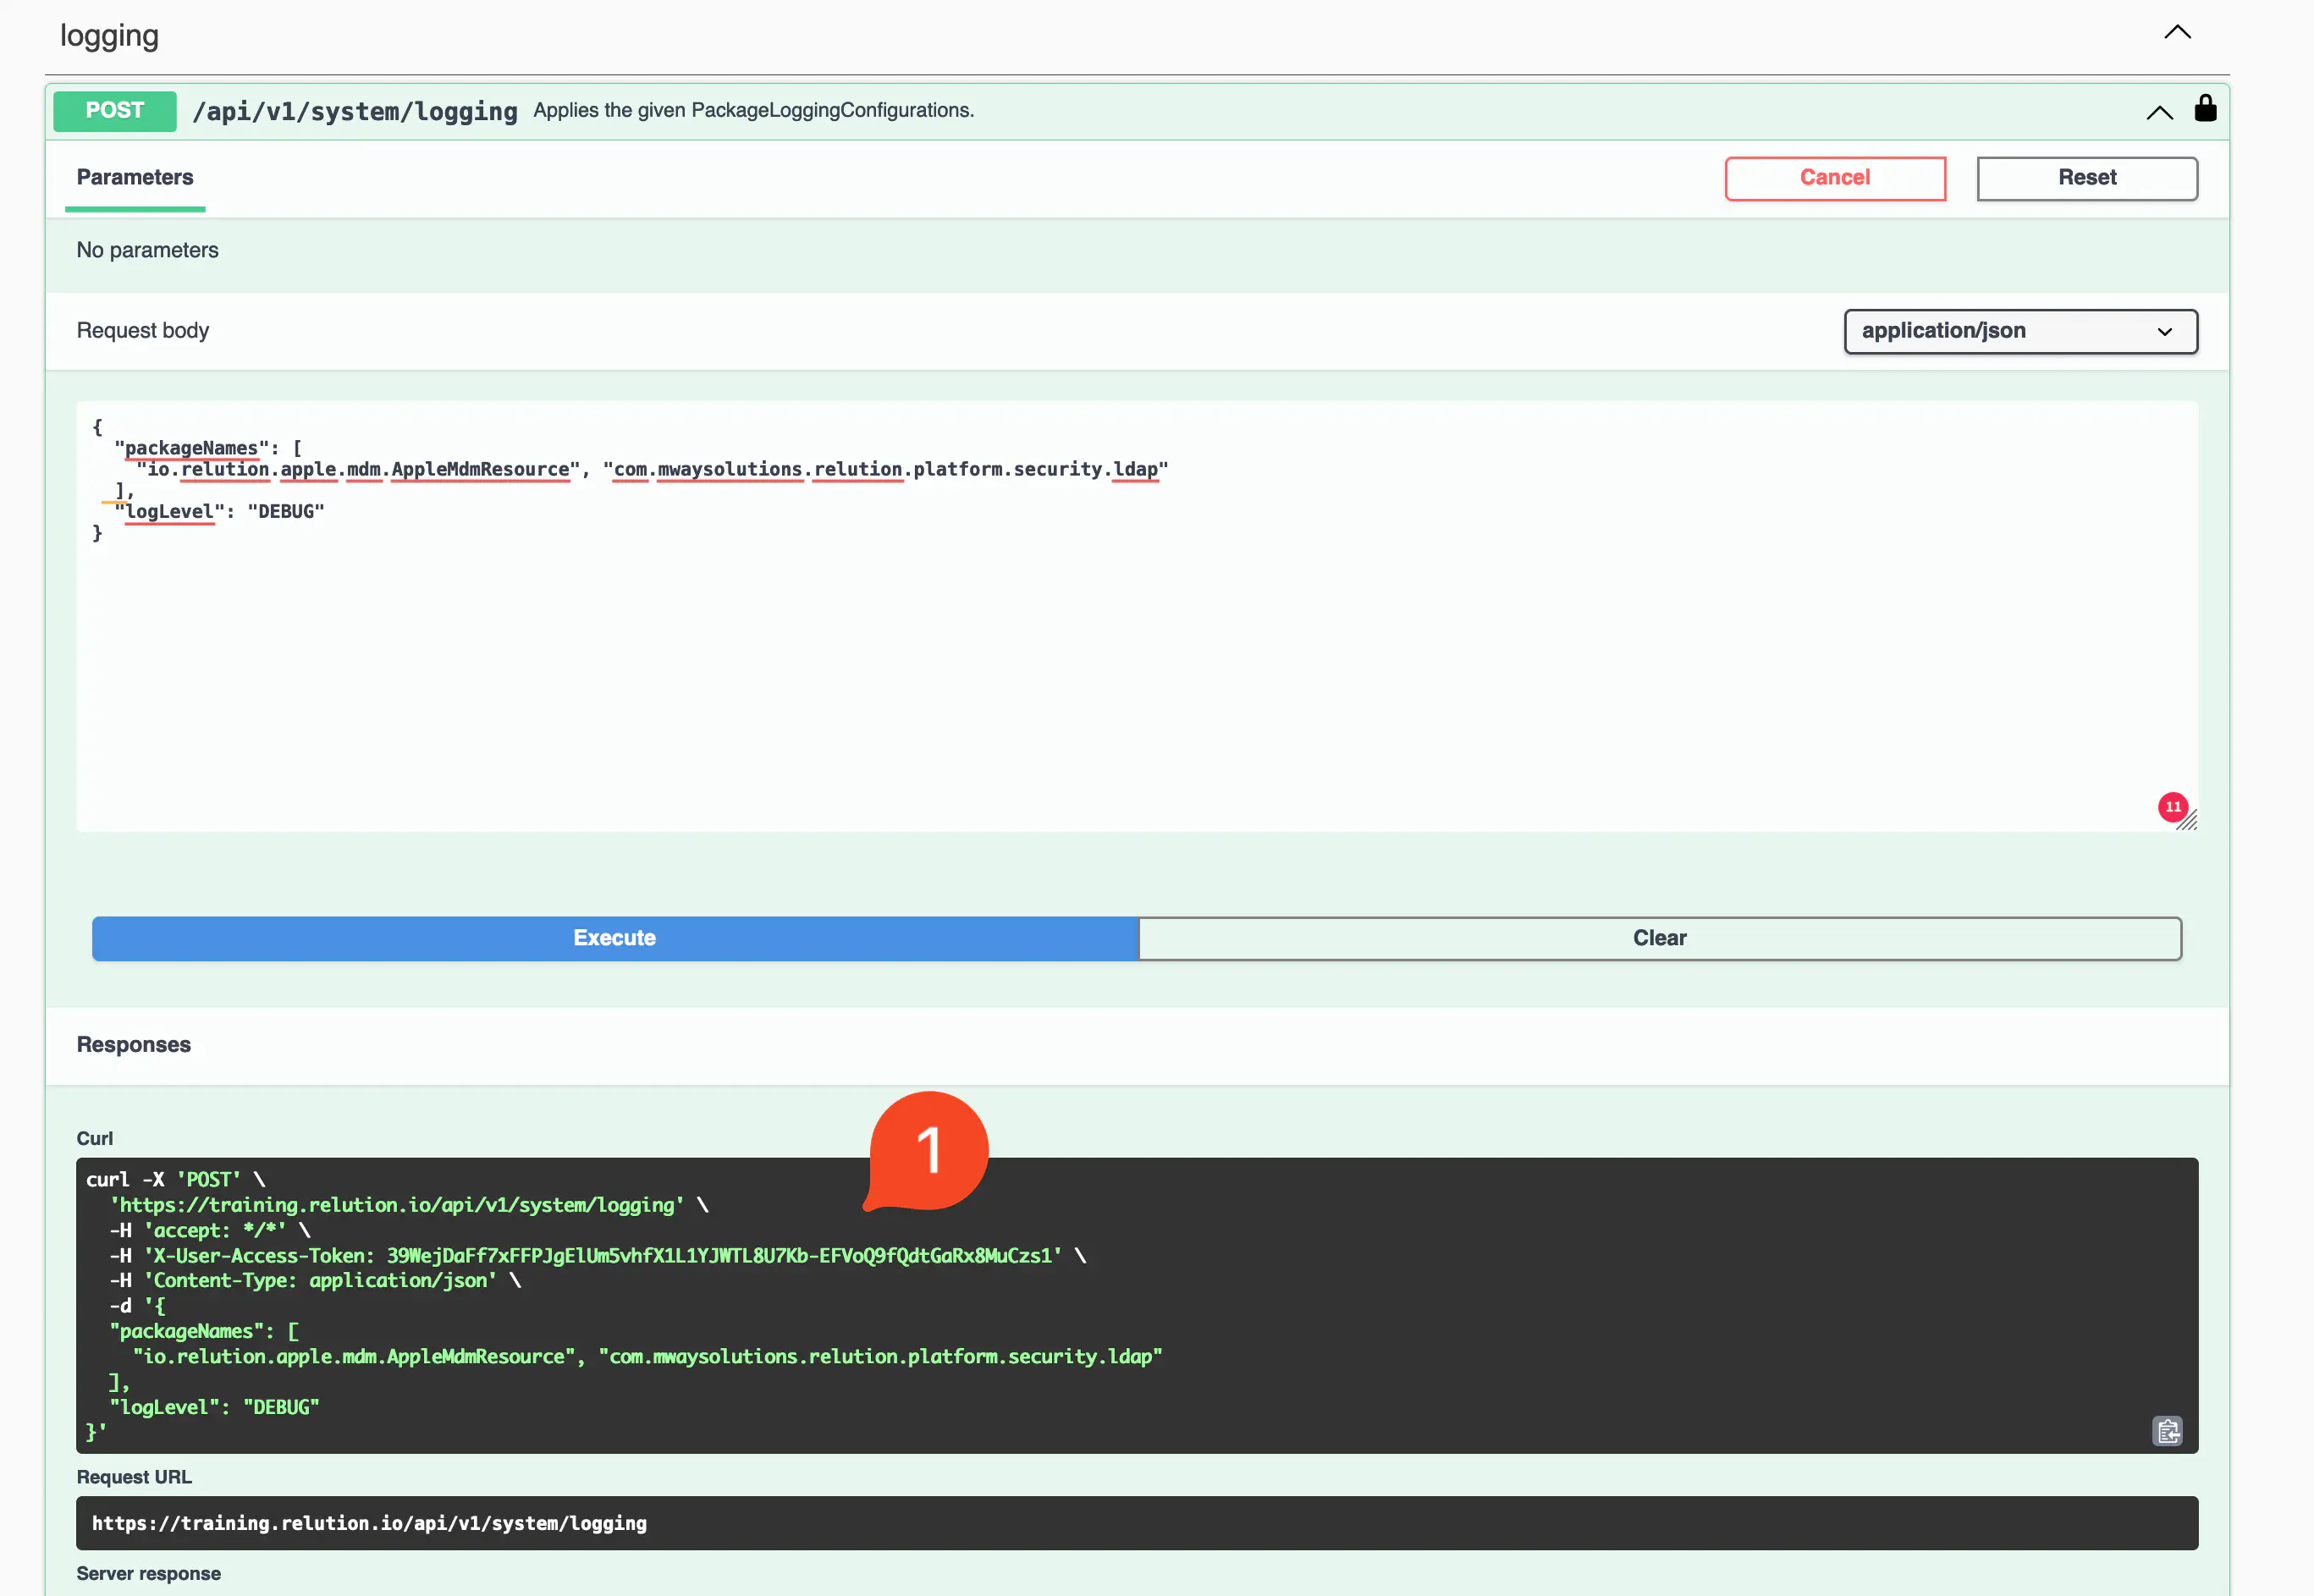
At the point “logging”, the required logging points as well as the log level can be defined and executed. Successful execution is confirmed with code 204 and the executed curl command is displayed.
In addition, it is possible to reset the logging to the default settings by triggering a reset or restore of the logging points.
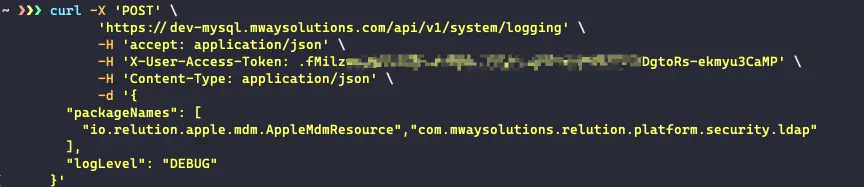
4. controlling the log level via the curl command
It is also possible to control the log level via the curl command by saving the curl generated via the Web API as an alias or script for future use.
5. use for support staff or other employees
To grant access to a user, for example a Relution support staff member, it is sufficient to, either pass on the token or the logging user’s email address, which is linked to a valid Relution instance, to the Relution support team.